
marsilea.upset.Upset#
- class Upset(data, orient='h', sort_sets=None, sets_order=None, sets_color=None, sort_subsets='cardinality', min_degree=None, max_degree=None, min_cardinality=None, max_cardinality=None, color='.1', shading=0.3, radius=50, linewidth=1.5, grid_background=0.1, fontsize=None, add_intersections=True, add_sets_size=True, add_labels=True, intersection_kws=None, sets_size_kws=None, sets_label_kws=None, width=None, height=None, size_scale=0.3, size_aspect=1.0)#
Bases:
WhiteBoardUpset Plot
- Parameters:
- data
UpsetData Upset data
- orientstr
The orientation of the Upset plot
- sets_orderarray of str
The order of sets
- sets_colorarray of color
The color for each set, this will also change the bar color in set size
- sort_sets{‘ascending’, ‘descending’}
The sorting order of sets
- sort_subsets{‘cardinality’, ‘degree’}
How to sort the subset, ‘size’ will sort by intersection size, ‘degree’ will sort by the number of intersected sets.
- min_degree, max_degreeint
Select a fraction of subset to render by degree
- min_cardinality, max_cardinalityint
Select a fraction of subset to render by cardinality
- colorcolor
The main color to use
- shadingfloat
The value to dilute the main color
- radiusfloat
The size of the dot
- linewidthfloat
The width of lines that connect the dots
- grid_backgroundfloat
The value to dilute the main color for background
- fontsizeint
Set the fontsize for the plot
- add_intersectionsbool, str, default: True
Whether or which side to add the intersection size.
- add_sets_sizebool, str, default: True
Whether or which side to add the sets size.
- add_labelsbool, str, default: True
Whether or which side to add the label.
- intersection_kwsdict, optional
Keyword arguments passed to the intersection size
Numbersplotter.- sets_size_kwsdict, optional
Keyword arguments passed to the sets size
Numbersplotter.- sets_label_kwsdict, optional
Keyword arguments passed to the sets label
Labelsplotter.- widthfloat
- heightfloat
- size_scalefloat
The scale of the plot
- size_aspectfloat
The aspect ratio of the plot
- data
Examples
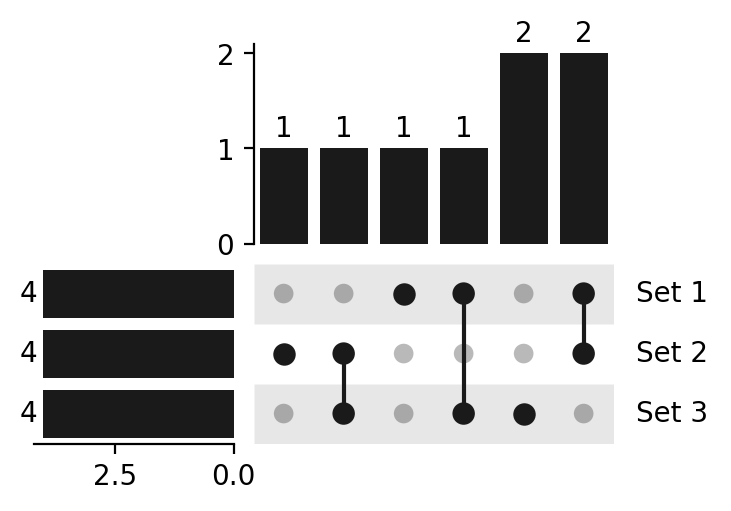
>>> from marsilea.upset import UpsetData, Upset
>>> data = UpsetData.from_sets([[1, 2, 3, 4],
>>>                             [3, 4, 5, 6],
>>>                             [1, 6, 10, 11]])
>>> Upset(data).render()
- add_intersections(side, pad=0.1, size=1.0, **props)#
- add_items_attr(side, attr_name=None, plot='bar', name=None, pad=0.1, size=None, plot_kws=None)#
Add a plot for the items attribute
The items attribute aligns to the subset axis (same axis as the intersection bars).
- Parameters:
- sidestr
The side to add the plot. For
orient='h'use ‘top’/’bottom’, fororient='v'use ‘left’/’right’.- attr_namestr
The name of the attribute (column in
items_attrs). Ignored whenplotis a plotter instance.- plotstr, plotter class or plotter instance, default: ‘bar’
The type of plot. A string is looked up in the registry (‘bar’, ‘box’, ‘boxen’, ‘violin’, ‘point’, ‘strip’, ‘swarm’, ‘stack_bar’, ‘number’); a plotter class is instantiated with the per-subset attribute data; a plotter instance is added as-is (you supply data ordered like
subset_order).- namestr, optional
The name of the plot
- padfloat, optional
The padding between the plot and the axis
- sizefloat, optional
The size of the plot
- plot_kwsdict, optional
The keyword arguments for the plot
- add_sets_attr(side, attr_name=None, plot='bar', name=None, pad=0.1, size=None, plot_kws=None)#
Add a plot for the sets attribute
The sets attribute aligns to the sets axis (same axis as the sets size).
- Parameters:
- sidestr
The side to add the plot. For
orient='h'use ‘left’/’right’, fororient='v'use ‘top’/’bottom’.- attr_namestr
The name of the attribute (column in
sets_attrs). Ignored whenplotis a plotter instance.- plotstr, plotter class or plotter instance, default: ‘bar’
The type of plot. A string is looked up in the registry (‘bar’, ‘box’, ‘boxen’, ‘violin’, ‘point’, ‘strip’, ‘swarm’, ‘stack_bar’, ‘number’); a plotter class is instantiated with the attribute data; a plotter instance is added as-is (you supply data ordered like
sets_order).- namestr, optional
The name of the plot
- padfloat, optional
The padding between the plot and the axis
- sizefloat, optional
The size of the plot
- plot_kwsdict, optional
The keyword arguments for the plot
- add_sets_label(side, pad=0.1, size=None, **props)#
- add_sets_size(side, pad=0.1, size=1.0, **props)#
- get_data()#
- get_intersection_ax()#
- get_sets_label_ax()#
- get_sets_size_ax()#
- highlight_subsets(present=None, absent=None, min_cardinality=None, max_cardinality=None, min_degree=None, max_degree=None, facecolor=None, edgecolor=None, edgewidth=None, hatch=None, edgestyle=None, label=None)#
Highlight a subset of the data.
Notice that the color of hatch is determined by the edgecolor.
- Parameters:
- present
The sets that present in the subset
- absent
The sets that absent in the subset
- min_cardinality
The minimum cardinality of the subset
- max_cardinality
The maximum cardinality of the subset
- min_degree
The minimum degree of the subset
- max_degree
The maximum degree of the subset
- facecolor
The facecolor to decorate the subset
- edgecolor
The color of the edge line
- edgewidth
The edgewidth of the edge line
- hatch
The fill pattern
- edgestyle
The style of edge line
- label
The label for the highlighting
- property sets_order#
Set names in plot order.
Use
series.reindex(upset.sets_order)to align set-axis data before passing a plotter instance toadd_sets_attr()or the inherited side methods.
- property subset_order#
Per-subset membership patterns in plot order.
Order subset-axis data like this, then pass an aligned plotter instance to
add_items_attr()or the inheritedadd_top/add_bottom(orient='h') /add_left/add_right(orient='v').
- classmethod update_attr_plotter(attr_plotter)#
Update the global upset plot for attr plotter