
marsilea.base.ClusterBoard#
- class ClusterBoard(cluster_data, width=None, height=None, name=None, margin=0.2, init_main=True)#
Bases:
WhiteBoardA main canvas class that can handle cluster data
- Parameters:
- cluster_datandarray
The cluster data
- widthfloat, optional
The width of the main canvas in inches
- heightfloat, optional
The height of the main canvas in inches
- namestr, optional
The name of the main canvas
- marginfloat, 4-tuple, optional
The margin of the main canvas in inches
- init_mainbool, optional
If True, the main canvas will be initialized
See also
- add_dendrogram(side, method=None, metric=None, linkage=None, meta_linkage=None, add_meta=True, add_base=True, add_divider=True, meta_color=None, linewidth=None, colors=None, divider_style='--', meta_ratio=0.2, height_scale=None, height_transform=None, show=True, name=None, size=0.5, pad=0.0, get_meta_center=None, rasterized=False)#
Run cluster and add dendrogram
Note
method and metric only works when you add the first row/col dendrogram.
If add_meta=False and add_base=False, the dendrogram axes will not be created.
- Parameters:
- side
- methodstr
See scipy’s
linkage- metricstr
See scipy’s
linkage- linkagendarray
Precomputed linkage matrix. See scipy’s
linkagefor specific format.- meta_linkagendarray
Precomputed chunk-level linkage matrix. See scipy’s
linkagefor specific format.- add_metaNone | bool
By default, add_meta is set to False if the linkage is provided, otherwise True. If the data is split, a meta dendrogram can be drawn for data chunks. The mean value of the data chunk is used to calculate linkage matrix for meta dendrogram.
- add_baseNone | bool
By default, add_meta is set to False if the linkage is provided, otherwise True. Draw the base dendrogram for each data chunk. You can turn this off if the base dendrogram is too crowded.
- add_dividerbool
Draw a divide line that tells the difference between base and meta dendrogram.
- divider_stylestr, default: “–”
The line style of the divide line
- meta_colorcolor
The color of the meta dendrogram
- meta_ratiofloat
The size of meta dendrogram relative to the base dendrogram. Exact when height_scale is not the default “minmax”.
- height_scale{“minmax”, “group”, “shared”}, default: “minmax”
What the merge heights are measured against.
“minmax” stretches each group’s own range over the full height, so every group’s dendrogram ends up the same height no matter how tightly its rows actually cluster.
“group” scales each group by its own tallest merge, keeping the proportions inside a group honest.
“shared” scales every group by the tallest merge anywhere, so heights can be compared between groups and a tight group draws genuinely short. Use this when the meta dendrogram looks unbalanced against dense base dendrograms.
- height_transform{None, “sqrt”, “log”, “rank”} or callable
Bend the heights without reordering them, to spread out merges that bunch up near the leaves. Worth reaching for with
method="ward", which is strongly bottom-heavy, and best left alone with the default “single”. A callable takes and returns an array in [0, 1]. Requires height_scale other than “minmax”, and gives up readable distances in exchange for legibility.- linewidthfloat
The linewidth for every dendrogram and divide line
- colorscolor, array of color
If only one color is specified, it will be applied to every dendrogram. If an array of color is specified, it will be applied to each base dendrogram.
- showbool
If False, the dendrogram will not be drawn and the axes will not be created.
- namestr
The name of the dendrogram axes
- sizefloat
- padfloat
- get_meta_center: callable
A function to calculate the centroid of data. It should accept a 2D numpy array as input and return a 1D numpy array of the same length as the number of columns in the input, representing the centroid. The default will use the mean values.
- rasterizedbool
If True, the dendrogram will be rasterized
Examples
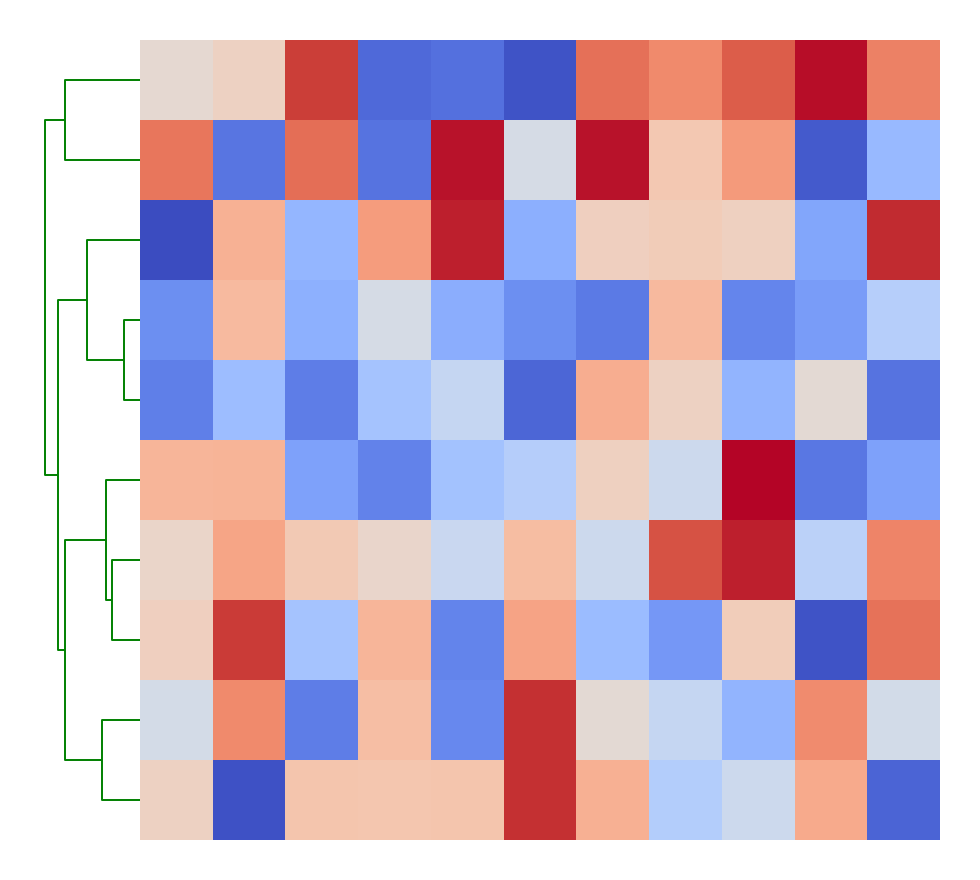
You can change how the linkage matrix is calculated
>>> data = np.random.rand(10, 11)
>>> import marsilea as ma
>>> h = ma.Heatmap(data)
>>> h.add_dendrogram("left", method="ward", colors="green")
>>> h.render()
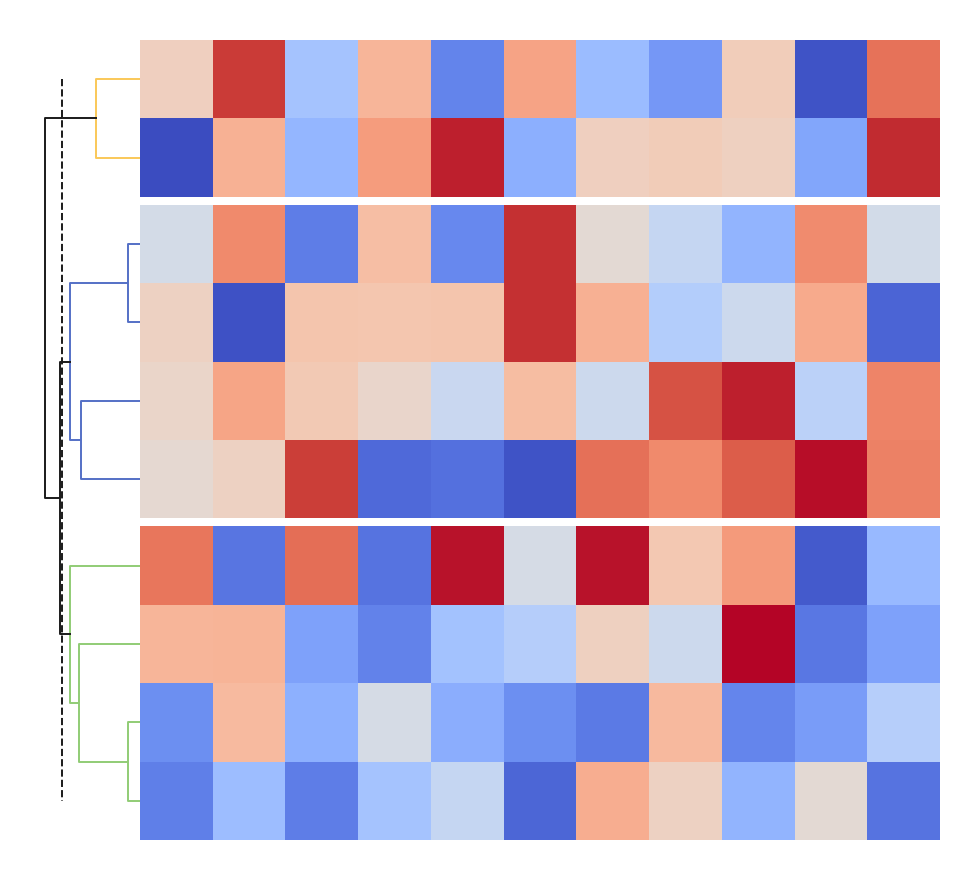
Only show the meta dendrogram to avoid crowded dendrogram
>>> h = ma.Heatmap(data)
>>> h.cut_rows(cut=[4, 8])
>>> h.add_dendrogram("left", add_base=False)
>>> h.render()

Change color for each base dendrogram
>>> h = ma.Heatmap(data)
>>> h.cut_rows(cut=[4, 8])
>>> h.add_dendrogram("left", colors=["#5470c6", "#91cc75", "#fac858"])
>>> h.render()
- property col_cluster#
If column dendrogram is added
- cut_cols(cut, spacing=0.01)#
Cut the main canvas by columns
- Parameters:
- cutarray-like
The index of your data to specify where to cut the canvas
- spacingfloat, optional
The spacing between each cut, default is 0.01
Examples
Cut the canvas by the index
>>> data = np.random.rand(10, 11)
>>> import marsilea as ma
>>> h = ma.Heatmap(data)
>>> h.cut_cols([4, 8])
>>> h.render()

- cut_rows(cut, spacing=0.01)#
Cut the main canvas by rows
- Parameters:
- cutarray-like
The index of your data to specify where to cut the canvas
- spacingfloat, optional
The spacing between each cut, default is 0.01
Examples
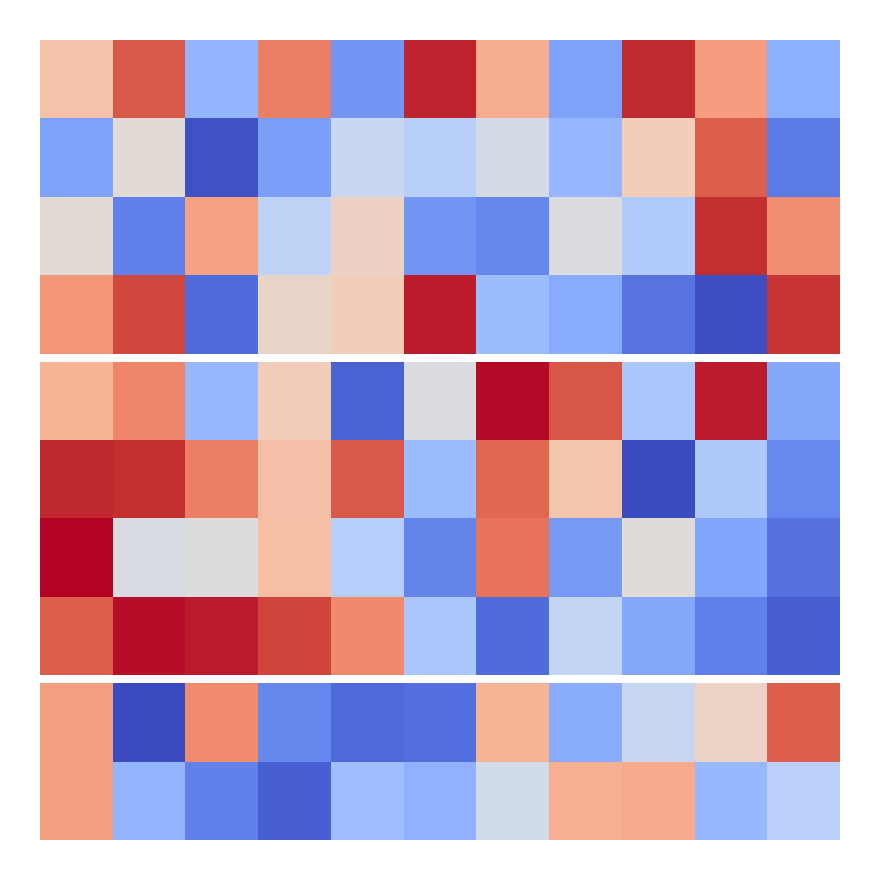
Cut the canvas by the index
>>> data = np.random.rand(10, 11)
>>> import marsilea as ma
>>> h = ma.Heatmap(data)
>>> h.cut_rows([4, 8])
>>> h.render()
- get_col_linkage()#
Return the linkage matrix of column dendrogram
If the canvas is not split, the linkage matrix will be returned; otherwise, a dictionary of linkage matrix will be returned, the key is either index or the name of each chunk. A chunk with a single column has nothing to merge and maps to None.
- get_deform()#
Return the deformation object of the cluster data
- get_row_linkage()#
Return the linkage matrix of row dendrogram
If the canvas is not split, the linkage matrix will be returned; otherwise, a dictionary of linkage matrix will be returned, the key is either index or the name of each chunk. A chunk with a single row has nothing to merge and maps to None.
- group_cols(group, order=None, spacing=0.01)#
Group columns into chunks
- Parameters:
- grouparray-like
The group of each column. May be a data reference, e.g.
A.var["gene_group"].- orderarray-like, optional
The order of the unique groups. If omitted and group is categorical, its category order is used; otherwise the groups are sorted.
- spacingfloat, optional
The spacing between each split chunks, default is 0.01
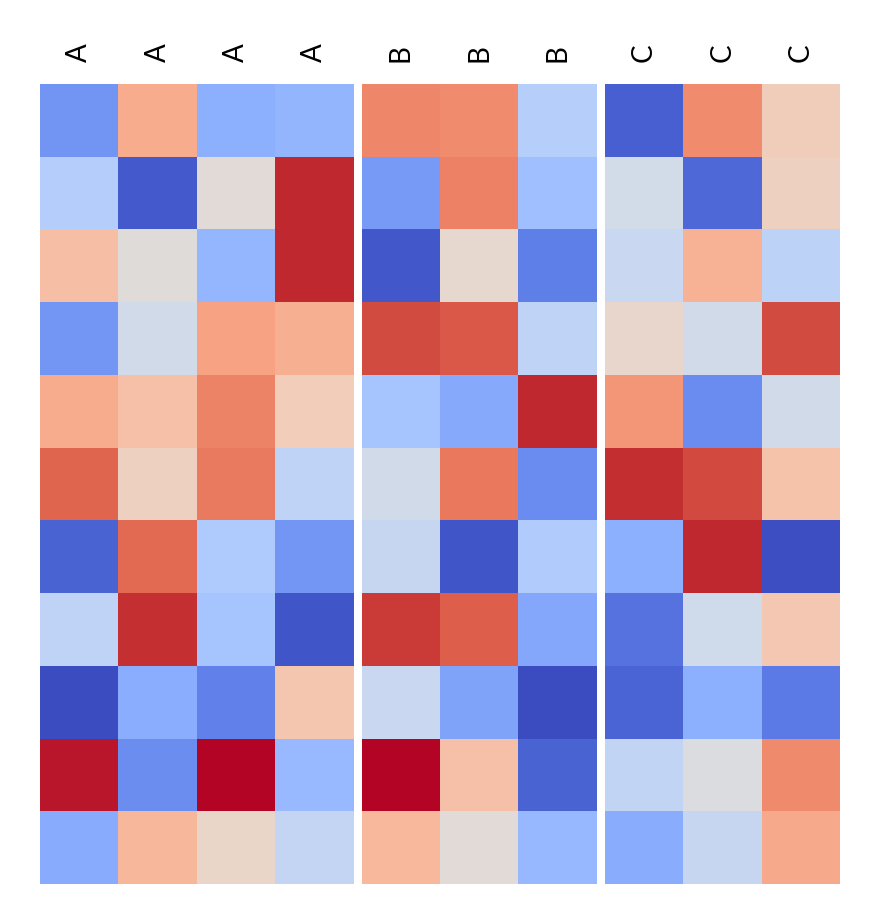
Examples
Group columns by the unique labels
>>> data = np.random.rand(11, 10)
>>> import marsilea as ma
>>> h = ma.Heatmap(data)
>>> labels = ["A", "B", "C", "A", "B", "C", "A", "B", "C", "A"]
>>> h.group_cols(labels, order=["A", "B", "C"])
>>> h.add_top(ma.plotter.Labels(labels), pad=0.1)
>>> h.render()
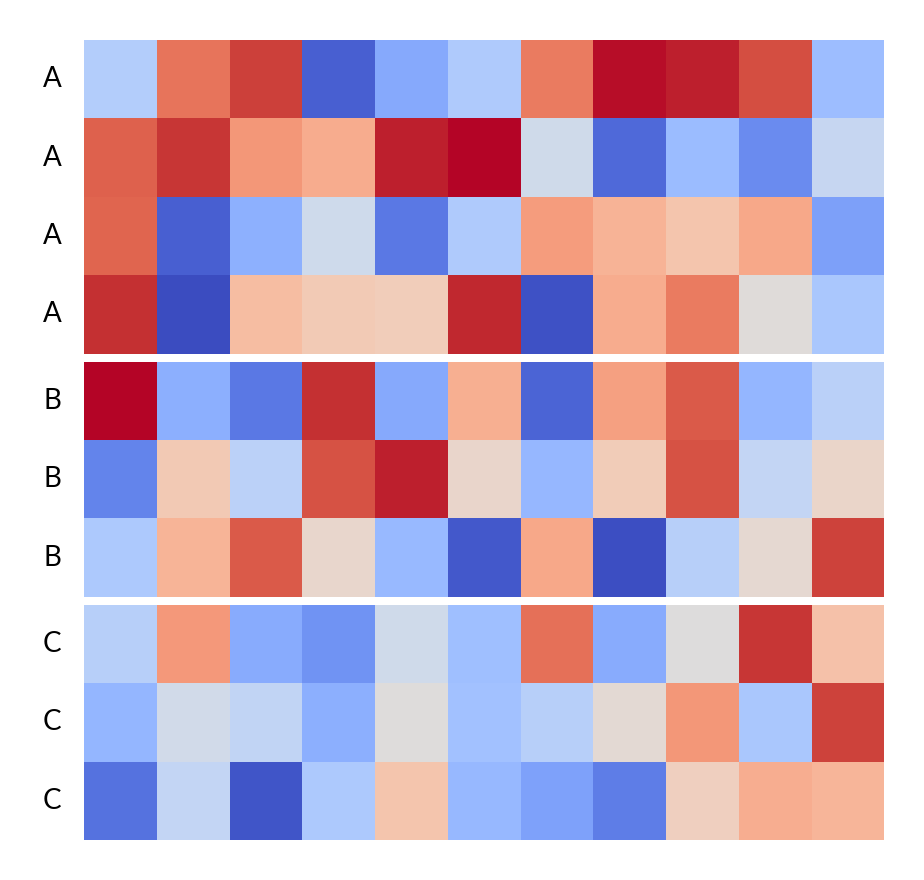
- group_rows(group, order=None, spacing=0.01)#
Group rows into chunks
- Parameters:
- grouparray-like
The group of each row. May be a data reference, e.g.
A.obs["leiden"].- orderarray-like, optional
The order of the unique groups. If omitted and group is categorical, its category order is used; otherwise the groups are sorted.
- spacingfloat, optional
The spacing between each split chunks, default is 0.01
Examples
Group rows by the unique labels
>>> data = np.random.rand(10, 11)
>>> import marsilea as ma
>>> h = ma.Heatmap(data)
>>> labels = ["A", "B", "C", "A", "B", "C", "A", "B", "C", "A"]
>>> h.group_rows(labels, order=["A", "B", "C"])
>>> h.add_left(ma.plotter.Labels(labels), pad=0.1)
>>> h.render()
- property row_cluster#
If row dendrogram is added