marsilea.plotter.Box#
- class Box(data, hue_order=None, palette=None, orient=None, legend_kws=None, group_kws=None, label=None, label_loc=None, label_props=None, **kwargs)#
Bases:
_SeabornBaseWrapper for seaborn’s boxplot
Note
About data format
You can only use wide-format for this plot, the number of columns of your input data should match your main data, this allow the data to be split and reorder if split and cluster is applied.
- Parameters:
- datanp.ndarray, pd.DataFrame
The wide-format data. To input ‘hue’ like data, you need to input a dict. eg:
{'hue1': data1, 'hue2': data2}.- hue_orderarray of str
The order of hue
- palettedict of label, color
- labelstr
The label of your data
- legend_kwsdict
Configurations for legend
- group_kwsdict
Configurations that apply to each group, should be something like
{'colors': ['C0', 'C1', 'C2']}if you have three groups.- kwargs
Examples
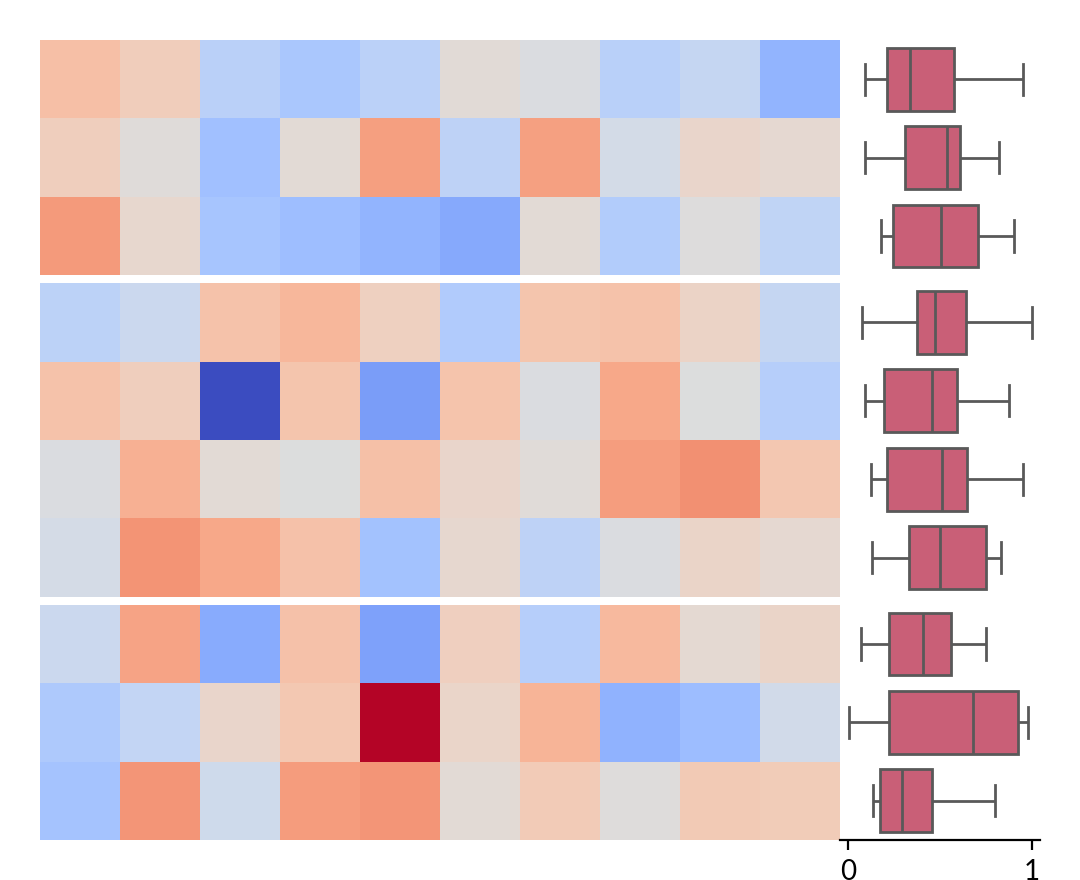
To render seaborn plots as side plots
>>> import marsilea as ma
>>> from marsilea.plotter import Box
>>> data = np.random.randn(10, 10)
>>> sdata = np.random.rand(10, 10)
>>> plot = Box(sdata, color='#DB4D6D')
>>> h = ma.Heatmap(data)
>>> h.cut_rows(cut=[3, 7])
>>> h.add_right(plot)
>>> h.render()
It’s possible to add hue data
>>> plot = Box({'a': sdata, 'b': sdata}, color='#DB4D6D')
>>> h = ma.Heatmap(data)
>>> h.cut_rows(cut=[3, 7])
>>> h.add_right(plot)
>>> h.render()

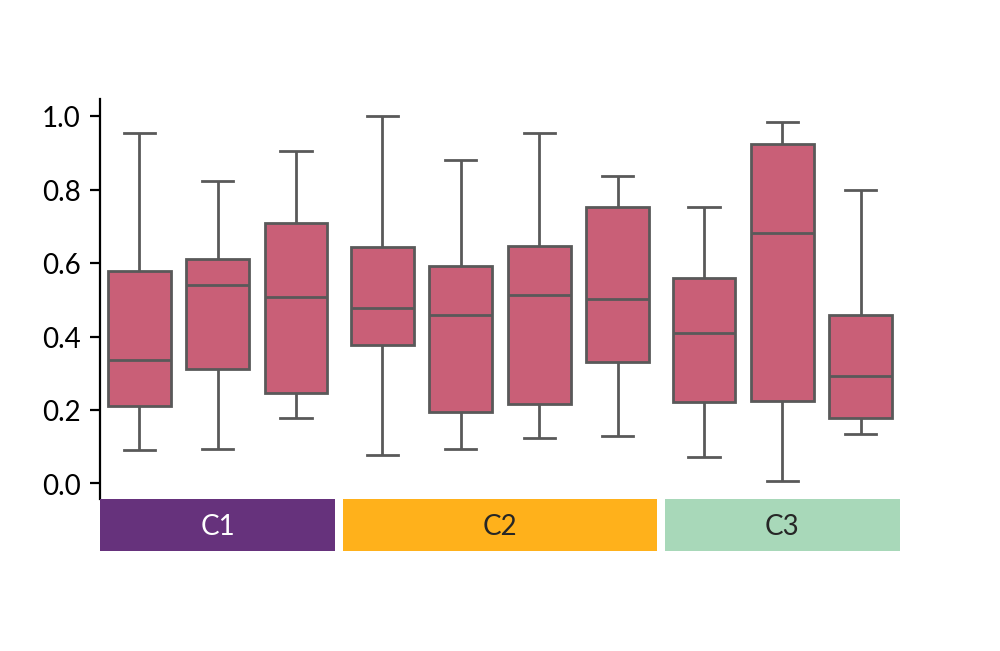
You can also draw it on the main canvas
>>> plot = Box(sdata, color='#DB4D6D')
>>> colors = ['#66327C', '#FFB11B', '#A8D8B9']
>>> anno = ma.plotter.Chunk(['C1', 'C2', 'C3'], colors, padding=10)
>>> cb = ma.ClusterBoard(data, height=2, margin=.5)
>>> cb.add_layer(plot)
>>> cb.cut_cols([3, 7])
>>> cb.add_bottom(anno)
>>> cb.render()
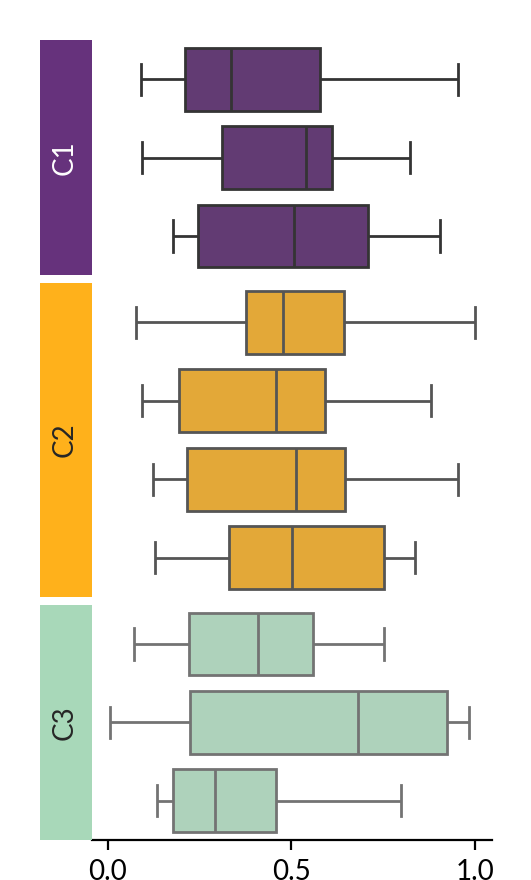
To layout in a different orient and style each group
>>> plot = Box(sdata, orient='h',
...                   group_kws={'color': colors})
>>> anno = ma.plotter.Chunk(['C1', 'C2', 'C3'], colors, padding=10)
>>> cb = ma.ClusterBoard(data.T, width=2)
>>> cb.add_layer(plot)
>>> cb.cut_rows([3, 7])
>>> cb.add_left(anno)
>>> cb.render()