marsilea.plotter.StackBar#
- class StackBar(data, items=None, colors=None, orient=None, show_value=False, value_loc='center', width=0.8, value_size=6, fmt=None, props=None, label=None, label_loc=None, label_props=None, value_pad=0, legend_kws=None, **kwargs)#
Bases:
_BarBaseStacked Bar
- Parameters:
- datanp.ndarray, pd.DataFrame
2D data, index of dataframe is used as the name of items.
- itemslist of str
The name of items.
- colorslist of colors, mapping of (item, color)
The colors of the bar for each item.
- orient{“v”, “h”}
The orientation of the plot
- show_valuebool
Whether to show value on the bar
- value_loc{“center”, “edge”}
The location of the value
- fmtstr, callable
Format the value show on the bar
- labelstr
The label of the plot
- value_padfloat
The spacing between value and the bar
- propsdict
- kwargs
Other keyword arguments passed to
matplotlib.axes.Axes.bar()
Examples
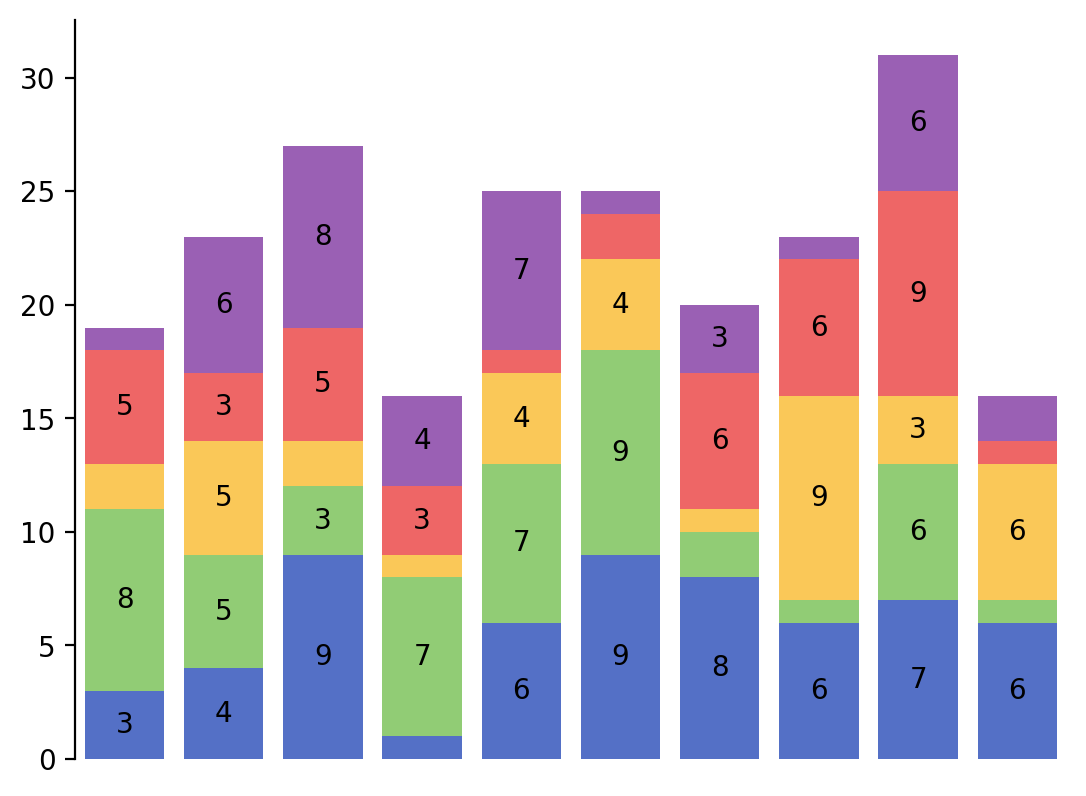
>>> from marsilea.plotter import StackBar
>>> stack_data = pd.DataFrame(
...     data=np.random.randint(1, 10, (5, 10)), index=list("abcde")
... )
>>> _, ax = plt.subplots()
>>> StackBar(stack_data).render(ax)

You may find the text is too big for a bar to display on, to not display certain value.
>>> fmt = lambda v: int(v) if v > 2 else ""
>>> _, ax = plt.subplots()
>>> StackBar(stack_data, show_value=True, fmt=fmt).render(ax)