Basics#

Complex annotated heatmap in Python

Complex annotated heatmap in Python

Heatmap in Python

Heatmap in Python

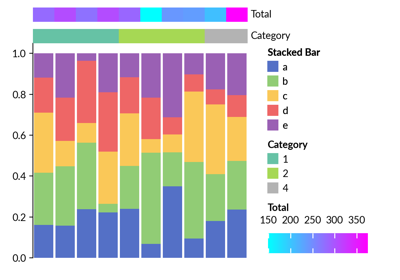
Stacked bar chart in Python

Stacked bar chart in Python

Two heatmaps side by side in Python

Two heatmaps side by side in Python

All Plotters#

Examples of all available plotters in Marsilea.

AnnoLabels

AnnoLabels

Arc

Arc

Area

Area

Bar

Bar

Box

Box

Boxen

Boxen

CenterBar

CenterBar

Chunk

Chunk

ColorMesh

ColorMesh

Colors

Colors

Emoji

Emoji

FixedChunk

FixedChunk

Image

Image

Labels

Labels

MarkerMesh

MarkerMesh

Numbers

Numbers

Point

Point

Range

Range

Sequence logo in Python

Sequence logo in Python

SizedMesh

SizedMesh

StackBar

StackBar

Strip

Strip

Swarm

Swarm

TextMesh

TextMesh

Title

Title

Violin

Violin

Real World Data Visualization#

Publication-ready figures made with Marsilea from real datasets: an oncoprint of TCGA breast cancer mutations, an UpSet plot of IMDB movie genres, single-cell RNA-seq and multi-omics panels, a multiple sequence alignment, genome tracks and more. Each page includes the complete, runnable script.

Arc diagram in Python: Les Misérables network

Arc diagram in Python: Les Misérables network

Current available plotters in Marsilea

Current available plotters in Marsilea

Bivariate distribution plot in Python (joint plot with marginals)

Bivariate distribution plot in Python (joint plot with marginals)

Spatial map annotation in Python: mouse embryo

Spatial map annotation in Python: mouse embryo

Cross-layout stacked bar chart in Python: fat in cooking oils

Cross-layout stacked bar chart in Python: fat in cooking oils

Oncoprint in Python: TCGA breast cancer mutations

Oncoprint in Python: TCGA breast cancer mutations

Single-cell RNA-seq heatmap in Python (PBMC 3k)

Single-cell RNA-seq heatmap in Python (PBMC 3k)

Single-cell multi-omics figure in Python

Single-cell multi-omics figure in Python

Sequence alignment plot in Python (MSA)

Sequence alignment plot in Python (MSA)

Significance annotation in Python (p-value brackets)

Significance annotation in Python (p-value brackets)

Bar chart with images in Python: TIOBE index

Bar chart with images in Python: TIOBE index

Genome track plot in Python

Genome track plot in Python

UpSet plot in Python: IMDB top 1000 movies

UpSet plot in Python: IMDB top 1000 movies

Gallery generated by Sphinx-Gallery