marsilea.plotter.ColorMesh#
- class ColorMesh(data, cmap=None, norm=None, vmin=None, vmax=None, mask=None, center=None, alpha=None, linewidth=None, linecolor=None, annot=None, fmt=None, annot_kws=None, cbar_kws=None, label=None, label_loc=None, label_props=None, **kwargs)#
Bases:
MeshBaseContinuous Heatmap
- Parameters:
- datanp.ndarray, pd.DataFrame
2D data
- cmapstr or
matplotlib.colors.Colormap The colormap used to map the value to the color
- norm
matplotlib.colors.Normalize A Normalize instance to map data
- vmin, vmaxnumber, optional
Value to determine the value mapping behavior
- centernumber, optional
The value to center on colormap, notice that this is different from seaborn; If set, a
matplotlib.colors.TwoSlopeNormwill be used to center the colormap.- maskarray-like
A bool matrix indicates which cell will be masked and not rendered
- alphafloat
The transparency value
- linewidthfloat
The width of grid line
- linecolorcolor
The color of grid line
- annotbool, array-like
Whether to show the value / The text to show in each cell
- fmtstr, callable
The format string or a function to format the value
- annot_kwsdict
- cbar_kwsdict
- labelstr
The label of the plot, only show if added to the side plot
- label_loc{‘top’, ‘bottom’, ‘left’, ‘right’}
Where to add the label
- label_propsdict
- kwargs
See also
Examples
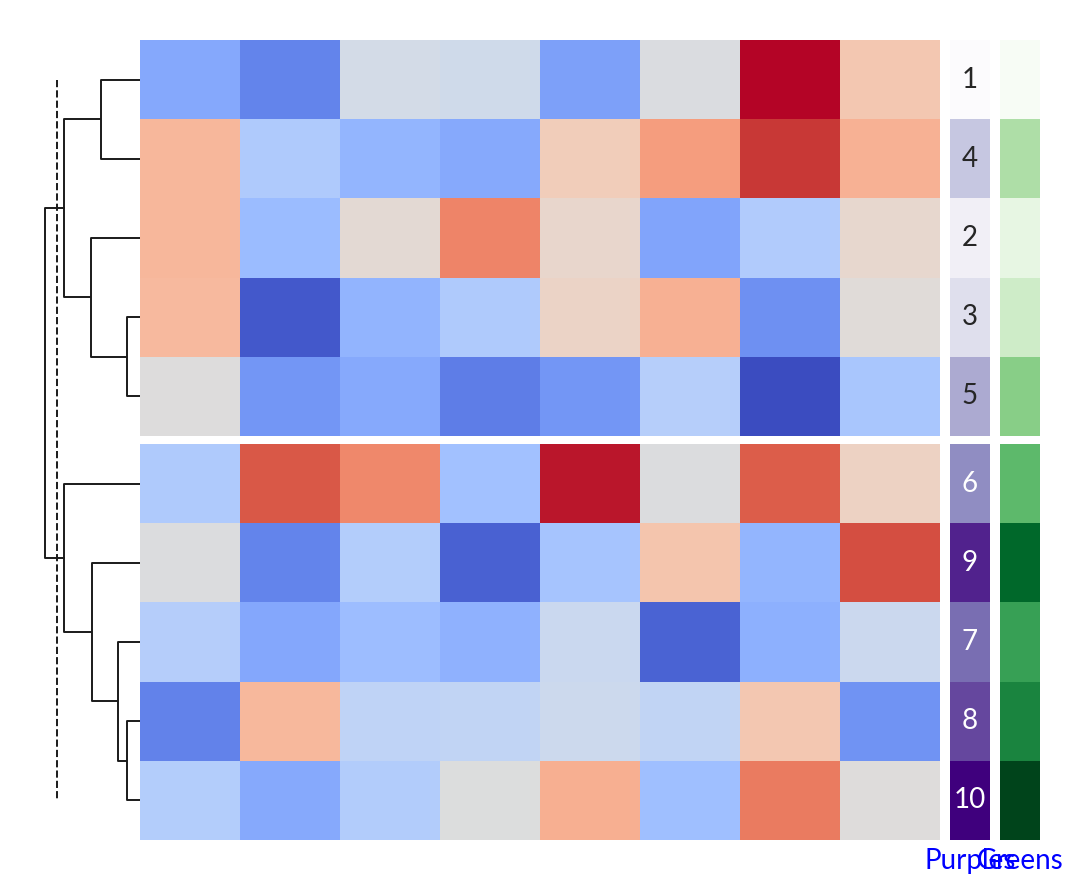
>>> import marsilea as ma
>>> from marsilea.plotter import ColorMesh
>>> _, ax = plt.subplots(figsize=(5, 0.5))
>>> ColorMesh(np.arange(10), cmap="Blues").render(ax)

>>> data = np.random.randn(10, 8)
>>> h = ma.Heatmap(data)
>>> h.cut_rows(cut=[5])
>>> h.add_dendrogram("left")
>>> cmap1, cmap2 = "Purples", "Greens"
>>> colors1 = ColorMesh(np.arange(10) + 1, cmap=cmap1, label=cmap1, annot=True)
>>> colors2 = ColorMesh(np.arange(10) + 1, cmap=cmap2, label=cmap2)
>>> h.add_right(colors1, size=0.2, pad=0.05)
>>> h.add_right(colors2, size=0.2, pad=0.05)
>>> h.render()