Note
Go to the end to download the full example code.
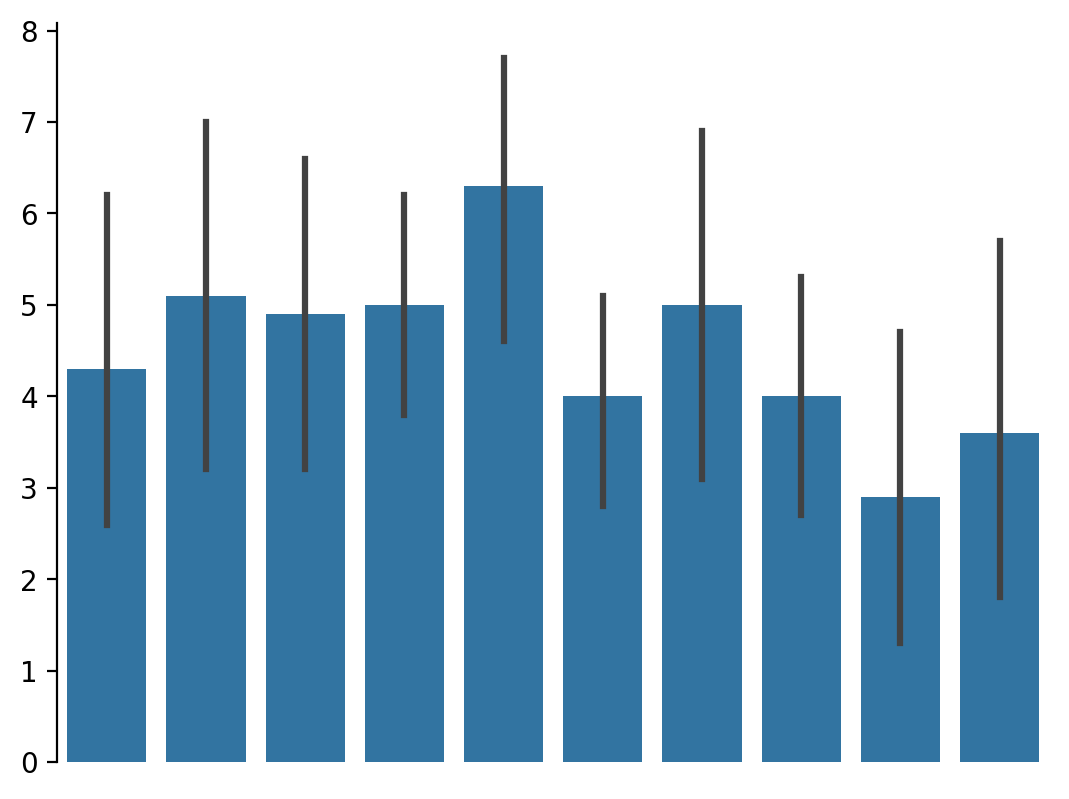
Bar#
Bar is a wrapper for seaborn’s barplot.
from marsilea.plotter import Bar
import numpy as np
import matplotlib.pyplot as plt

_, ax = plt.subplots()
data = np.random.randint(0, 10, (10, 10))
Bar(data).render(ax)
    var  value
0     0      3
1     0      6
2     0      4
3     0      3
4     0      0
..  ...    ...
95    9      0
96    9      0
97    9      6
98    9      5
99    9      9

[100 rows x 2 columns]
{'x': 'var', 'y': 'value'}
Total running time of the script: (0 minutes 0.554 seconds)