Note
Go to the end to download the full example code.
Current available plotters in Marsilea#
Import libraries
import numpy as np
import matplotlib.pyplot as plt
import pandas as pd

import marsilea as ma
import marsilea.plotter as mp

from marsilea.layers import Rect, RightTri, FrameRect, FracRect


def label_ax(ax, text):
    ax.text(
        1.05, 0.5, text, fontsize=16, transform=ax.transAxes, ha="left", va="center"
    )
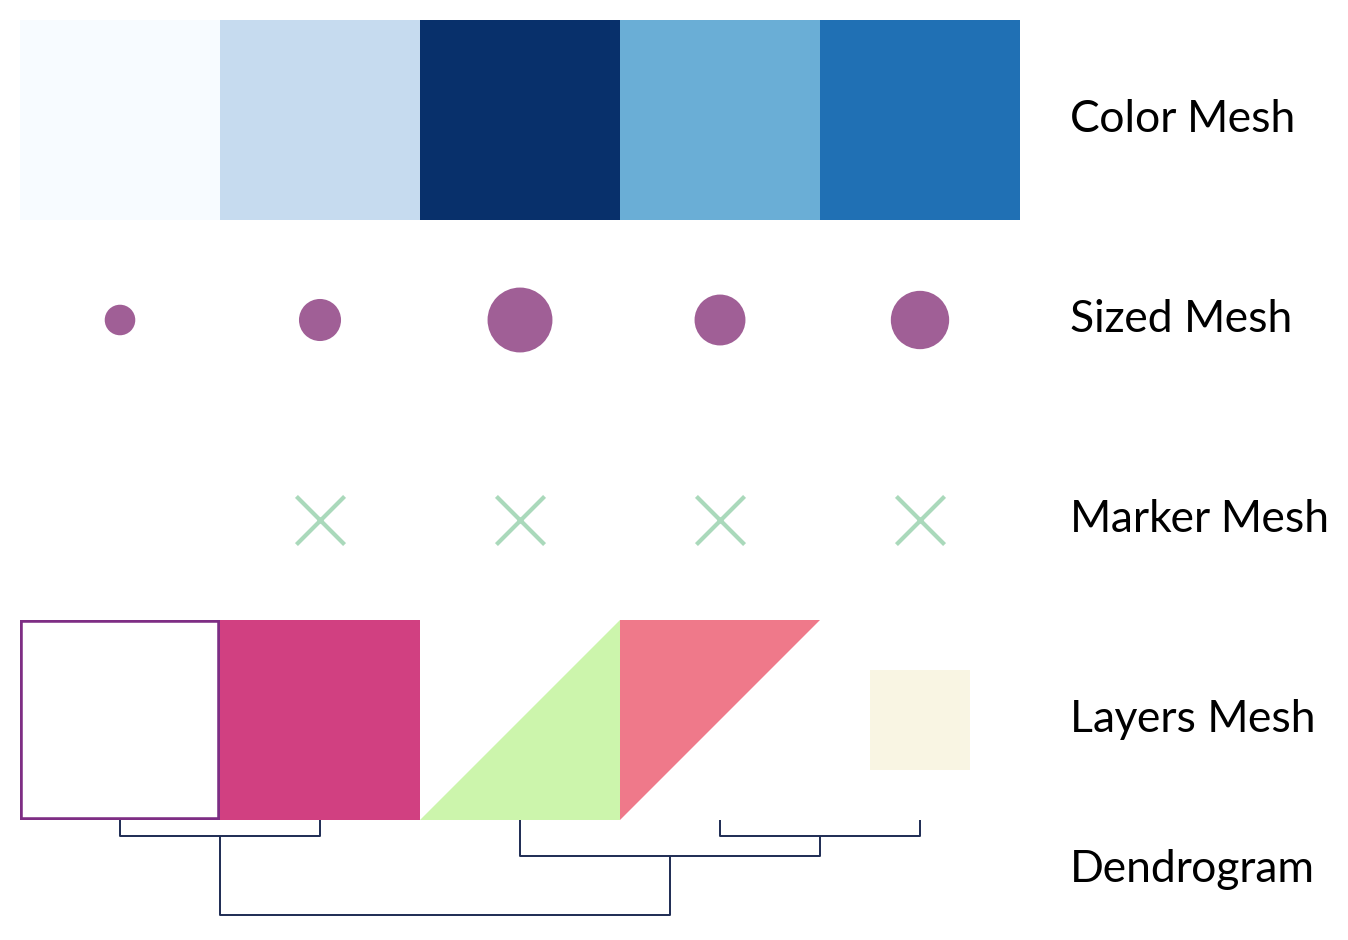
Mesh plotters
plt.ion()
rng = np.random.default_rng(0)
data = np.arange(5)
data2d = np.arange(5).reshape(1, 5)
pieces = {
    0: FrameRect(color="#7E2E84", width=2),
    1: Rect(color="#D14081"),
    2: RightTri(color="#EF798A"),
    3: FracRect(color="#F9F5E3", frac=(0.5, 0.5)),
    4: RightTri(color="#CCF5AC", right_angle="upper right"),
}

plotters = {
    "Color Mesh": mp.ColorMesh(data2d, cmap="Blues"),
    "Sized Mesh": mp.SizedMesh(data2d, sizes=(100, 500), color="#A05F96"),
    "Marker Mesh": mp.MarkerMesh(data2d > 0, size=300, marker="x", color="#AAD9BB"),
    "Layers Mesh": ma.layers.LayersMesh(data2d, pieces=pieces),
}

canvas = ma.ZeroHeightCluster(data2d, width=5)
for title, plotter in plotters.items():
    canvas.add_bottom(plotter, name=title)

canvas.add_dendrogram("bottom", method="ward", colors="#1D2B53", name="Dendrogram")
canvas.render()

for title in list(plotters.keys()) + ["Dendrogram"]:
    ax = canvas.get_ax(title)
    ax.set_axis_off()
    label_ax(ax, title)
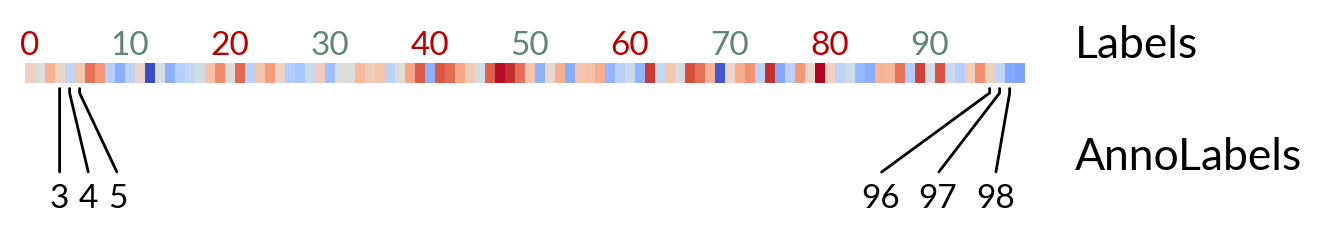
Label plotters
labels = np.arange(100)
text, text_color = [], []
for t in labels:
    if t % 10 == 0:
        text.append(t)
        if t / 10 % 2 == 0:
            text_color.append("#B80000")
        else:
            text_color.append("#5F8670")
    else:
        text.append("")
        text_color.append(".1")
matrix = rng.standard_normal((1, 100))
canvas2 = ma.Heatmap(matrix, width=5, height=0.1)
canvas2.add_top(
    mp.Labels(text, text_props={"color": text_color}, rotation=0), name="Labels"
)
canvas2.add_bottom(
    mp.AnnoLabels(labels, mark=[3, 4, 5, 96, 97, 98], rotation=0), name="AnnoLabels"
)
canvas2.render()

for title in ["Labels", "AnnoLabels"]:
    ax = canvas2.get_ax(title)
    label_ax(ax, title)
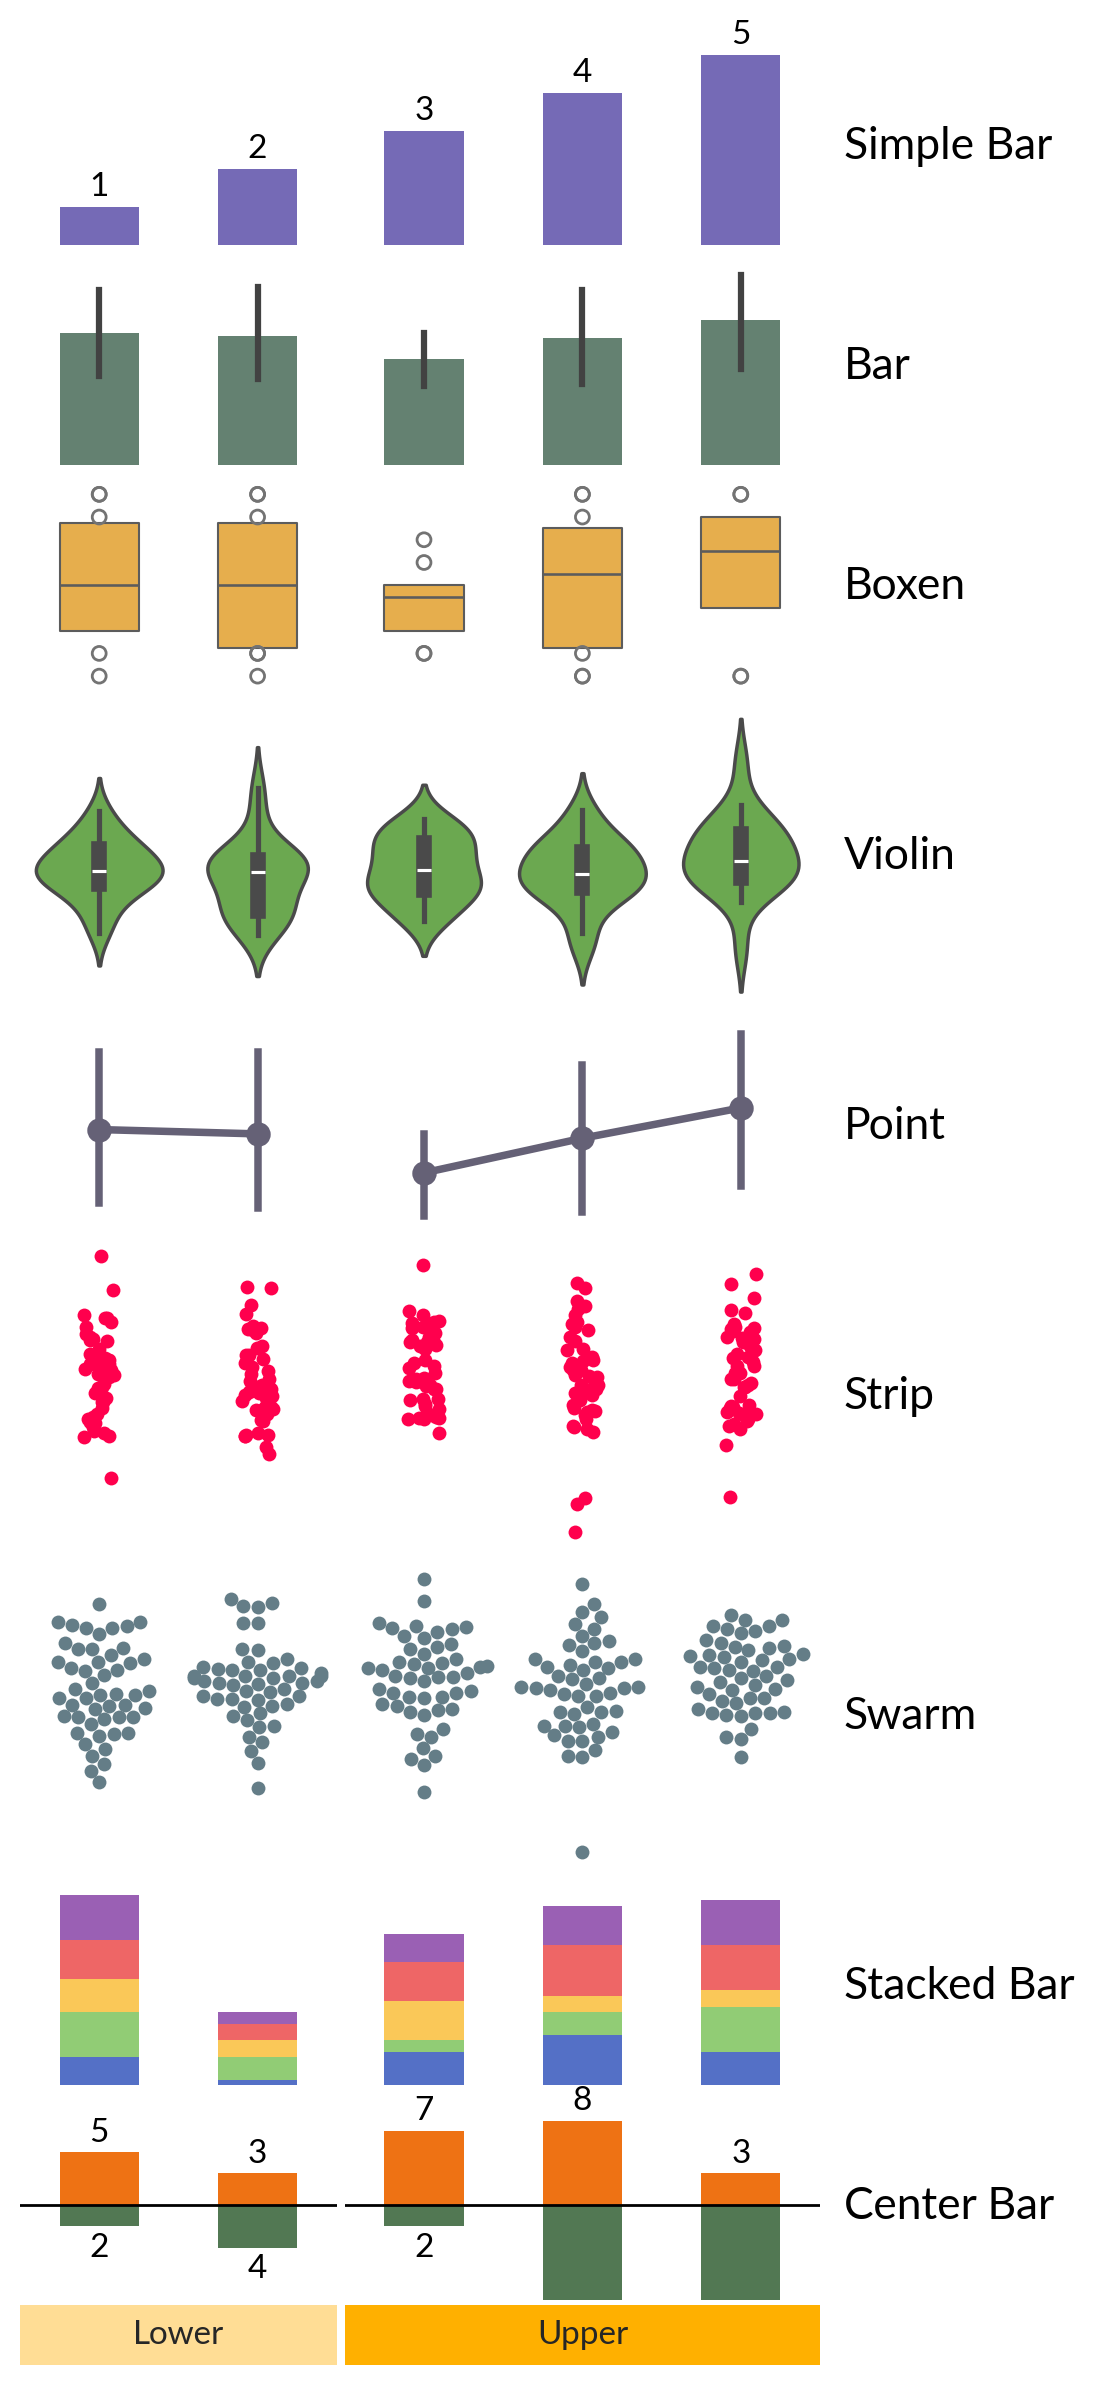
Statistics plotters
data1d = np.arange(1, 6)
data2d = rng.integers(1, 10, size=(10, 5))
bar_width = 0.5

plotters = {
    "Simple Bar": mp.Numbers(data1d, color="#756AB6", width=bar_width),
    "Bar": mp.Bar(data2d, color="#5F8670", width=bar_width),
    "Boxen": mp.Boxen(data2d, color="#FFB534", width=bar_width),
    "Violin": mp.Violin(rng.standard_normal((20, 5)), color="#65B741"),
    "Point": mp.Point(data2d, color="#656176"),
    "Strip": mp.Strip(rng.standard_normal((50, 5)), color="#FF004D"),
    "Swarm": mp.Swarm(rng.standard_normal((50, 5)), color="#647D87"),
    "Stacked Bar": mp.StackBar(
        rng.integers(1, 10, (5, 5)), items="abcde", width=bar_width
    ),
    "Center Bar": mp.CenterBar(
        rng.integers(1, 10, (5, 2)), colors=["#EE7214", "#527853"], width=bar_width
    ),
}

canvas3 = ma.Heatmap(rng.standard_normal((10, 5)), width=4, height=0)
for title, plotter in plotters.items():
    size = 1
    if title in ["Violin", "Strip", "Swarm"]:
        size = 1.5
    canvas3.add_bottom(plotter, pad=0.1, size=size, name=title)

canvas3.cut_cols(cut=[2])
canvas3.add_bottom(mp.Chunk(["Lower", "Upper"], ["#FFDD95", "#FFB000"], padding=10))

canvas3.render()
for ax in canvas3.figure.get_axes():
    # close axes spines
    for dir in ["left", "right", "top", "bottom"]:
        ax.spines[dir].set_visible(False)
    ax.tick_params(left=False, labelleft=False)

for title in plotters.keys():
    ax = canvas3.get_ax(title)[-1]
    label_ax(ax, title)
    var  value
0     0      9
1     0      3
2     0      2
3     0      7
4     0      9
5     0      7
6     0      3
7     0      1
8     0      8
9     0      3
10    1      8
11    1      4
12    1      9
13    1      2
14    1      7
15    1      2
16    1      1
17    1      6
18    1      9
19    1      3
{'color': '#5F8670', 'width': 0.5, 'x': 'var', 'y': 'value'}
    var  value
0     0      2
1     0      5
2     0      7
3     0      6
4     0      3
5     0      5
6     0      5
7     0      4
8     0      2
9     0      3
10    1      9
11    1      6
12    1      1
13    1      5
14    1      1
15    1      9
16    1      8
17    1      3
18    1      6
19    1      2
20    2      9
21    2      4
22    2      8
23    2      1
24    2      1
25    2      9
26    2      6
27    2      4
28    2      7
29    2      8
{'color': '#5F8670', 'width': 0.5, 'x': 'var', 'y': 'value'}
    var  value
0     0      9
1     0      3
2     0      2
3     0      7
4     0      9
5     0      7
6     0      3
7     0      1
8     0      8
9     0      3
10    1      8
11    1      4
12    1      9
13    1      2
14    1      7
15    1      2
16    1      1
17    1      6
18    1      9
19    1      3
{'color': '#FFB534', 'width': 0.5, 'x': 'var', 'y': 'value'}
    var  value
0     0      2
1     0      5
2     0      7
3     0      6
4     0      3
5     0      5
6     0      5
7     0      4
8     0      2
9     0      3
10    1      9
11    1      6
12    1      1
13    1      5
14    1      1
15    1      9
16    1      8
17    1      3
18    1      6
19    1      2
20    2      9
21    2      4
22    2      8
23    2      1
24    2      1
25    2      9
26    2      6
27    2      4
28    2      7
29    2      8
{'color': '#FFB534', 'width': 0.5, 'x': 'var', 'y': 'value'}
    var     value
0     0 -0.769515
1     0 -1.043001
2     0  1.041840
3     0  0.339620
4     0 -0.358913
5     0 -0.288767
6     0 -1.485375
7     0  0.513052
8     0 -0.049801
9     0  1.066935
10    0 -0.152193
11    0 -0.204522
12    0  0.519842
13    0 -1.944265
14    0  1.643252
15    0 -0.663535
16    0 -0.476377
17    0  0.135731
18    0  0.565818
19    0 -0.077345
20    1 -1.422742
21    1  0.268417
22    1  1.402265
23    1  0.423771
24    1 -1.901635
25    1  0.083475
26    1  0.300685
27    1 -0.297584
28    1  0.086619
29    1  0.047673
30    1 -1.473888
31    1 -1.042860
32    1 -0.476579
33    1 -1.307753
34    1 -1.282649
35    1 -0.613418
36    1  0.163340
37    1  2.310363
38    1 -0.007211
39    1 -2.016661
{'color': '#65B741', 'x': 'var', 'y': 'value'}
    var     value
0     0  0.258453
1     0  0.358672
2     0  1.150166
3     0  0.371227
4     0 -0.108915
5     0 -0.849606
6     0 -0.106072
7     0 -0.530008
8     0 -1.487073
9     0  0.916655
10    0  1.028854
11    0  0.613123
12    0  1.388980
13    0  1.086831
14    0 -0.585658
15    0 -1.605149
16    0 -1.292646
17    0 -0.787193
18    0 -0.561198
19    0 -0.648601
20    1 -0.568549
21    1  1.322457
22    1 -2.365304
23    1  0.382757
24    1 -0.803732
25    1 -0.510622
26    1 -1.185720
27    1 -0.236155
28    1  1.647339
29    1  0.370947
30    1 -1.934960
31    1 -0.200330
32    1  0.351455
33    1 -0.050604
34    1 -0.472588
35    1  0.729349
36    1 -0.471813
37    1  0.580284
38    1 -0.867617
39    1  0.678040
40    2 -1.029804
41    2 -0.013915
42    2  1.228684
43    2  0.319414
44    2  1.080163
45    2 -0.011533
46    2 -2.398233
47    2  1.816476
48    2  0.917488
49    2  0.613189
50    2 -0.239937
51    2 -0.436868
52    2 -0.474333
53    2 -0.283125
54    2  0.586337
55    2  0.806139
56    2  1.377951
57    2 -0.195506
58    2  3.066037
59    2 -0.500008
{'color': '#65B741', 'x': 'var', 'y': 'value'}
    var  value
0     0      9
1     0      3
2     0      2
3     0      7
4     0      9
5     0      7
6     0      3
7     0      1
8     0      8
9     0      3
10    1      8
11    1      4
12    1      9
13    1      2
14    1      7
15    1      2
16    1      1
17    1      6
18    1      9
19    1      3
{'color': '#656176', 'x': 'var', 'y': 'value'}
    var  value
0     0      2
1     0      5
2     0      7
3     0      6
4     0      3
5     0      5
6     0      5
7     0      4
8     0      2
9     0      3
10    1      9
11    1      6
12    1      1
13    1      5
14    1      1
15    1      9
16    1      8
17    1      3
18    1      6
19    1      2
20    2      9
21    2      4
22    2      8
23    2      1
24    2      1
25    2      9
26    2      6
27    2      4
28    2      7
29    2      8
{'color': '#656176', 'x': 'var', 'y': 'value'}
    var     value
0     0  1.360446
1     0 -0.699967
2     0 -1.181683
3     0  1.296915
4     0  0.199218
..  ...       ...
95    1  0.426105
96    1 -0.891732
97    1 -1.938168
98    1 -0.802170
99    1 -0.857926

[100 rows x 2 columns]
{'color': '#FF004D', 'x': 'var', 'y': 'value'}
     var     value
0      0 -0.152339
1      0  1.204396
2      0 -0.963854
3      0  0.854584
4      0  2.552424
..   ...       ...
145    2 -0.349799
146    2  0.786944
147    2  1.068077
148    2 -0.344973
149    2  0.160743

[150 rows x 2 columns]
{'color': '#FF004D', 'x': 'var', 'y': 'value'}
    var     value
0     0  1.400888
1     0  0.547096
2     0 -1.176257
3     0 -0.790545
4     0 -1.888349
..  ...       ...
95    1  0.477179
96    1  0.152151
97    1 -0.371901
98    1  0.540970
99    1  0.342515

[100 rows x 2 columns]
{'color': '#647D87', 'x': 'var', 'y': 'value'}
     var     value
0      0 -0.252689
1      0 -0.486761
2      0 -0.344999
3      0  0.217571
4      0  0.665066
..   ...       ...
145    2  0.143670
146    2  0.294800
147    2 -0.349463
148    2  0.917672
149    2  1.188328

[150 rows x 2 columns]
{'color': '#647D87', 'x': 'var', 'y': 'value'}
Other plotters
matrix = pd.DataFrame(data=rng.integers(1, 10, (4, 5)), index=list("ACGT"))
colors = {"A": "#D81159", "C": "#218380", "G": "#FBB13C", "T": "#73D2DE"}
weights = rng.integers(1, 10, 4)
seqlogo = mp.SeqLogo(matrix, color_encode=colors)
arc = mp.Arc(
    [1, 2, 3, 4, 5],
    [(1, 5), (2, 3), (1, 2), (4, 5)],
    weights=weights,
    width=(2, 5),
    colors="#534D56",
)

canvas4 = ma.ZeroHeightCluster(rng.standard_normal((10, 5)), width=4)
canvas4.add_top(seqlogo, size=2, name="Sequence Logo")
canvas4.add_top(arc, size=1, pad=0.2, name="Arc Diagram")
canvas4.render()

for title in ["Sequence Logo", "Arc Diagram"]:
    ax = canvas4.get_ax(title)
    label_ax(ax, title)

Total running time of the script: (0 minutes 5.118 seconds)