Note
Go to the end to download the full example code.
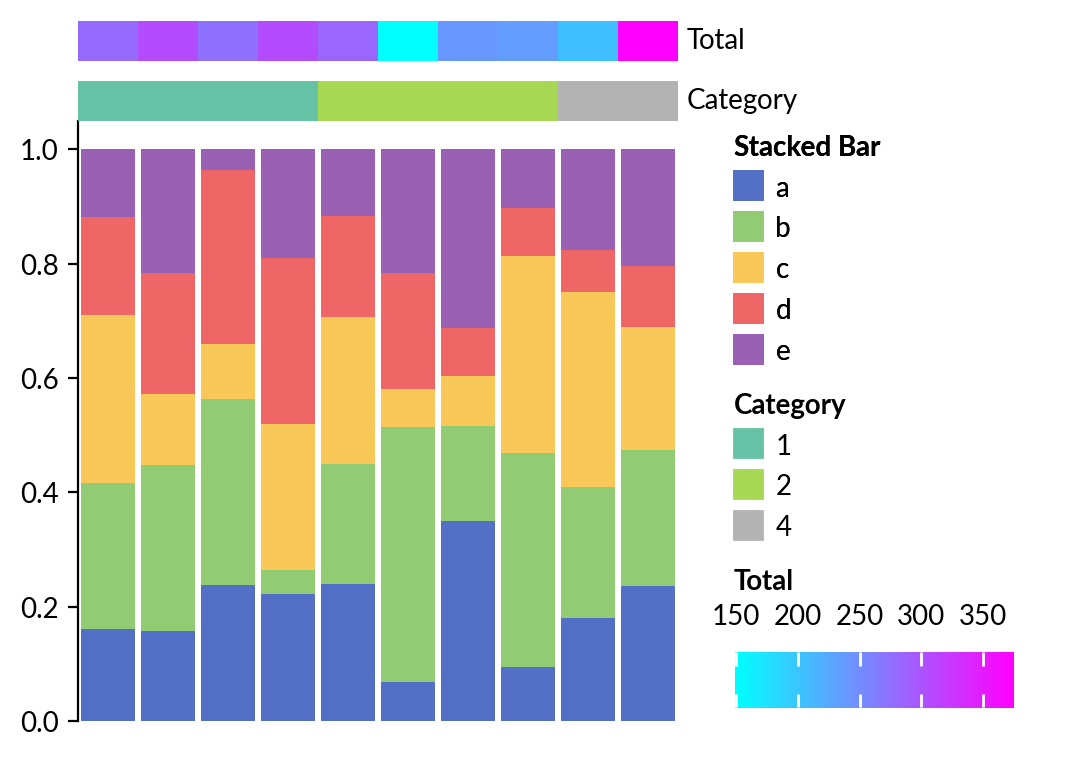
Annotate stacked bar#
import matplotlib.pyplot as plt
import numpy as np
import pandas as pd
import marsilea as ma
import marsilea.plotter as mp


np.random.seed(0)
data = np.random.randint(1, 100, (5, 10))
data = pd.DataFrame(data=data, index=list("abcde"))

bar = mp.StackBar(data / data.sum(), width=0.9, legend_kws=dict(title="Stacked Bar"))
top_colors = mp.Colors([1, 1, 2, 2, 4], cmap="Set2", label="Category")
top_mesh = mp.ColorMesh(
    data.sum(), cmap="cool", label="Total", cbar_kws=dict(orientation="horizontal")
)

wb = ma.WhiteBoard(width=3, height=3, margin=0.2)
wb.add_layer(bar)
wb.add_top(top_colors, size=0.2)
wb.add_top(top_mesh, size=0.2, pad=0.1)
wb.add_legends()
wb.set_margin(0.2)
wb.render()
Total running time of the script: (0 minutes 2.158 seconds)