Note
Go to the end to download the full example code.
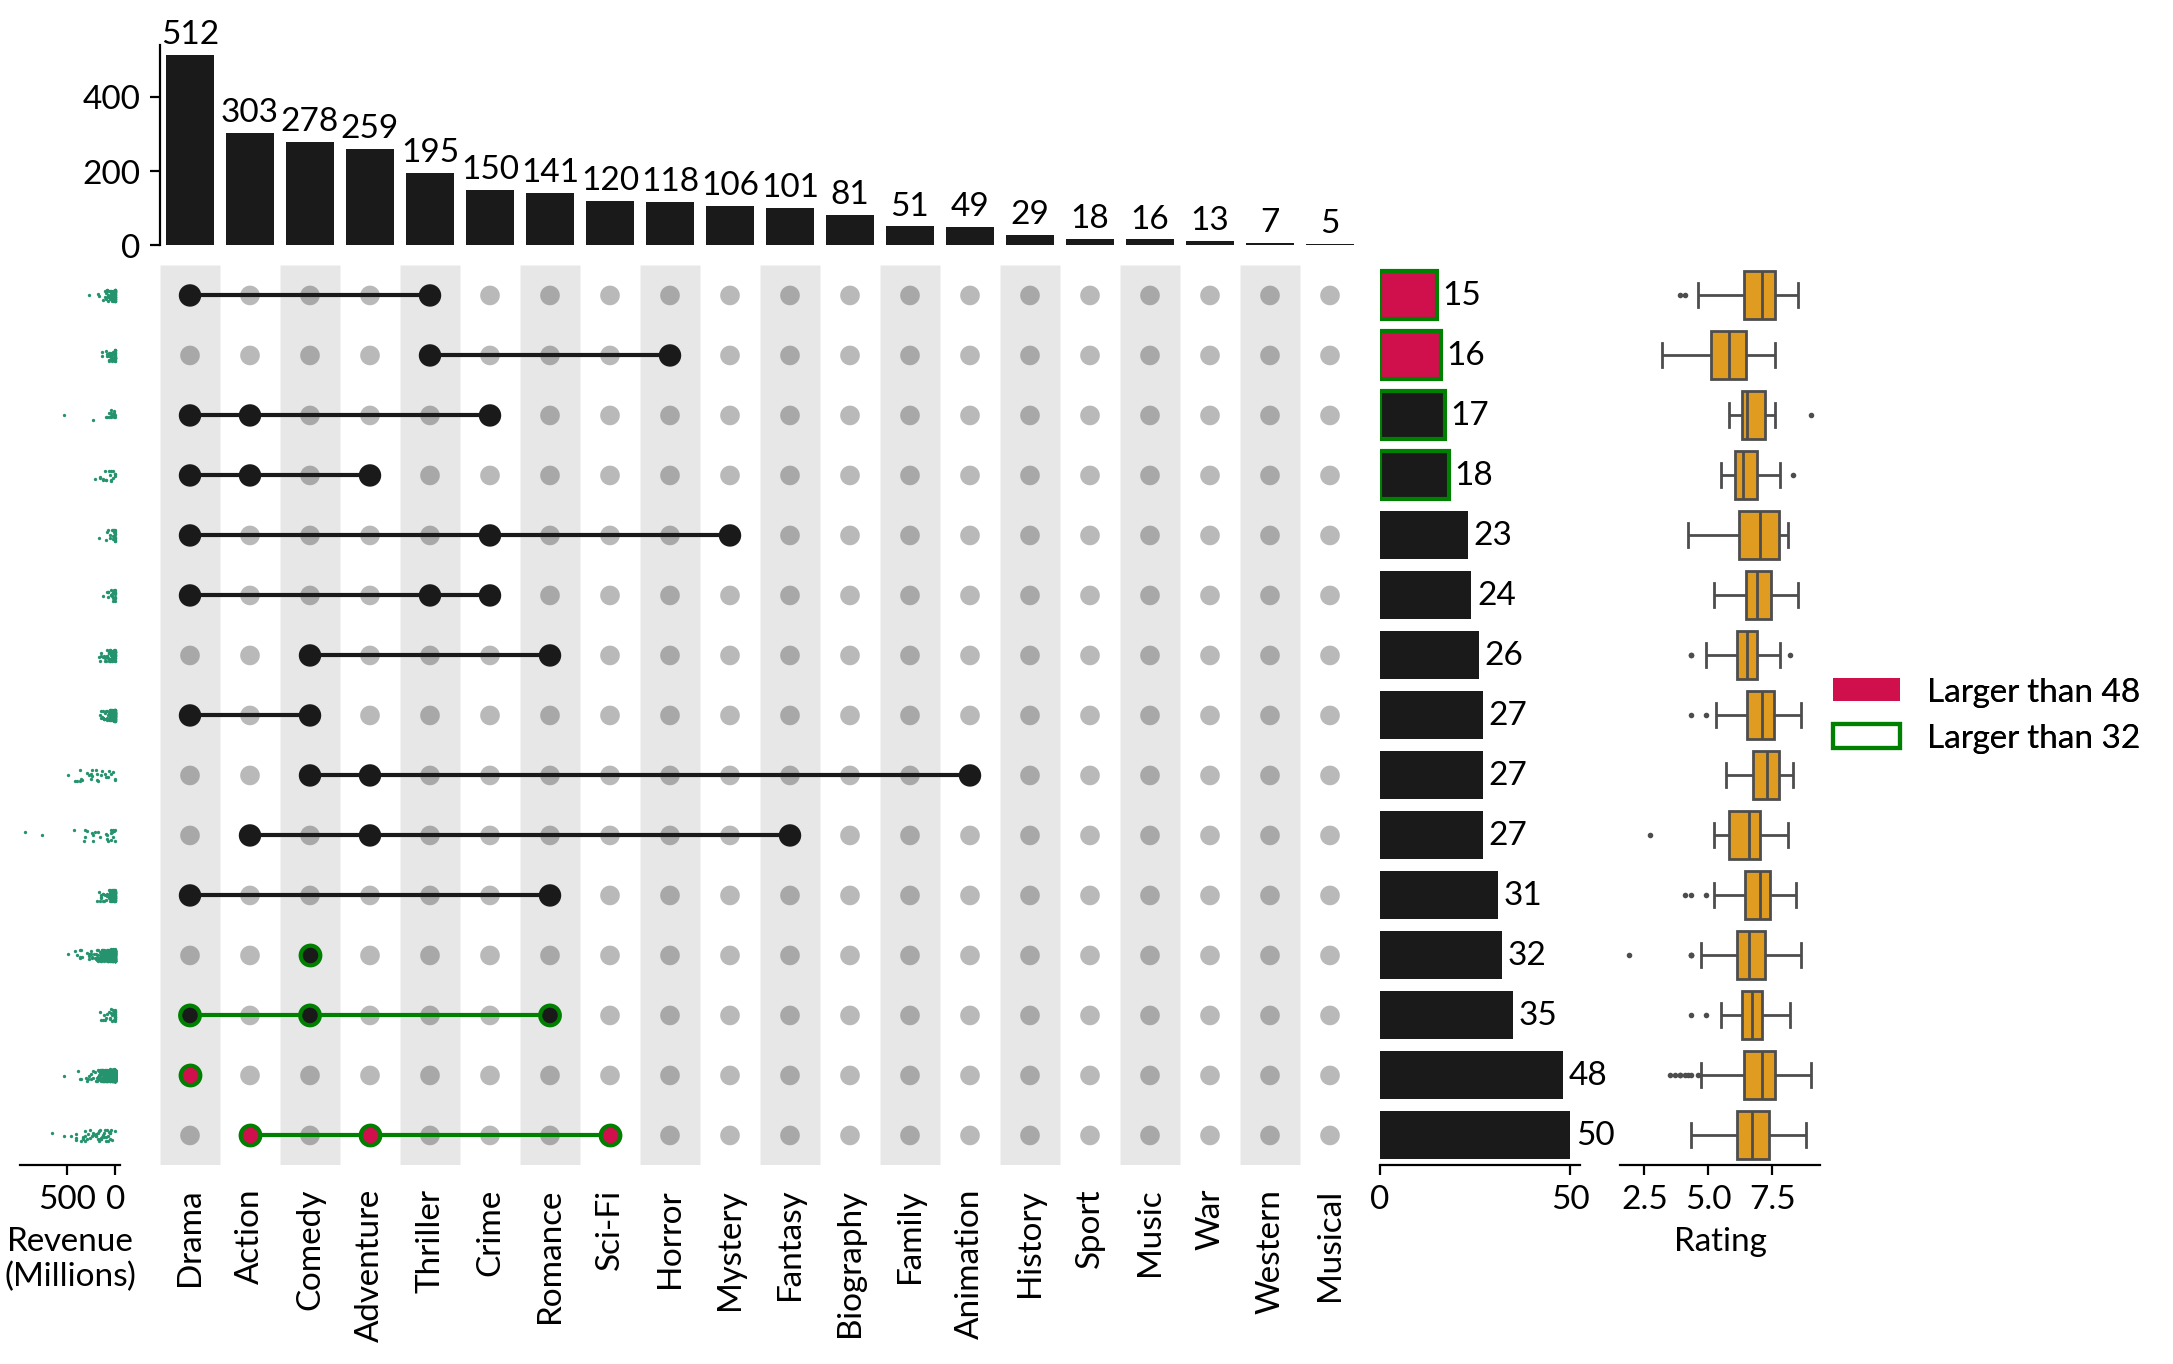
Upset Plot#
IMDB Top 1000 Movies
       var   value
0        0    7.22
1        0   10.64
2        0    3.44
3        0  166.15
4        0   31.86
...    ...     ...
12055   14  402.08
12056   14  150.17
12057   14  122.51
12058   14  200.07
12059   14   60.52

[12060 rows x 2 columns]
{'color': '#24936E', 'size': 1.2, 'x': 'value', 'y': 'var'}
       var  value
0        0    6.7
1        0    7.5
2        0    7.3
3        0    4.1
4        0    7.4
...    ...    ...
12055   14    6.0
12056   14    5.8
12057   14    5.8
12058   14    6.1
12059   14    4.9

[12060 rows x 2 columns]
{'color': 'orange', 'linewidth': 1, 'fliersize': 1, 'x': 'value', 'y': 'var'}
from matplotlib import pyplot as plt

import marsilea as ma
from marsilea.upset import UpsetData


imdb = ma.load_data("imdb")

items_attrs = imdb[
    [
        "Title",
        "Year",
        "Runtime (Minutes)",
        "Rating",
        "Votes",
        "Revenue (Millions)",
        "Metascore",
    ]
].set_index("Title")

upset_data = UpsetData.from_memberships(
    imdb.Genre.str.split(","), items_names=imdb["Title"], items_attrs=items_attrs
)

us = ma.upset.Upset(upset_data, orient="v", min_cardinality=15)
us.highlight_subsets(min_cardinality=48, facecolor="#D0104C", label="Larger than 48")
us.highlight_subsets(
    min_cardinality=32, edgecolor="green", edgewidth=1.5, label="Larger than 32"
)
us.add_items_attr(
    "left",
    "Revenue (Millions)",
    "strip",
    pad=0.2,
    size=0.5,
    plot_kws=dict(color="#24936E", size=1.2, label="Revenue\n(Millions)"),
)
us.add_items_attr(
    "right",
    "Rating",
    "box",
    pad=0.2,
    plot_kws=dict(color="orange", linewidth=1, fliersize=1),
)

us.add_legends(box_padding=0)
us.set_margin(0.3)
us.render()
Total running time of the script: (0 minutes 2.480 seconds)