Note
Go to the end to download the full example code.
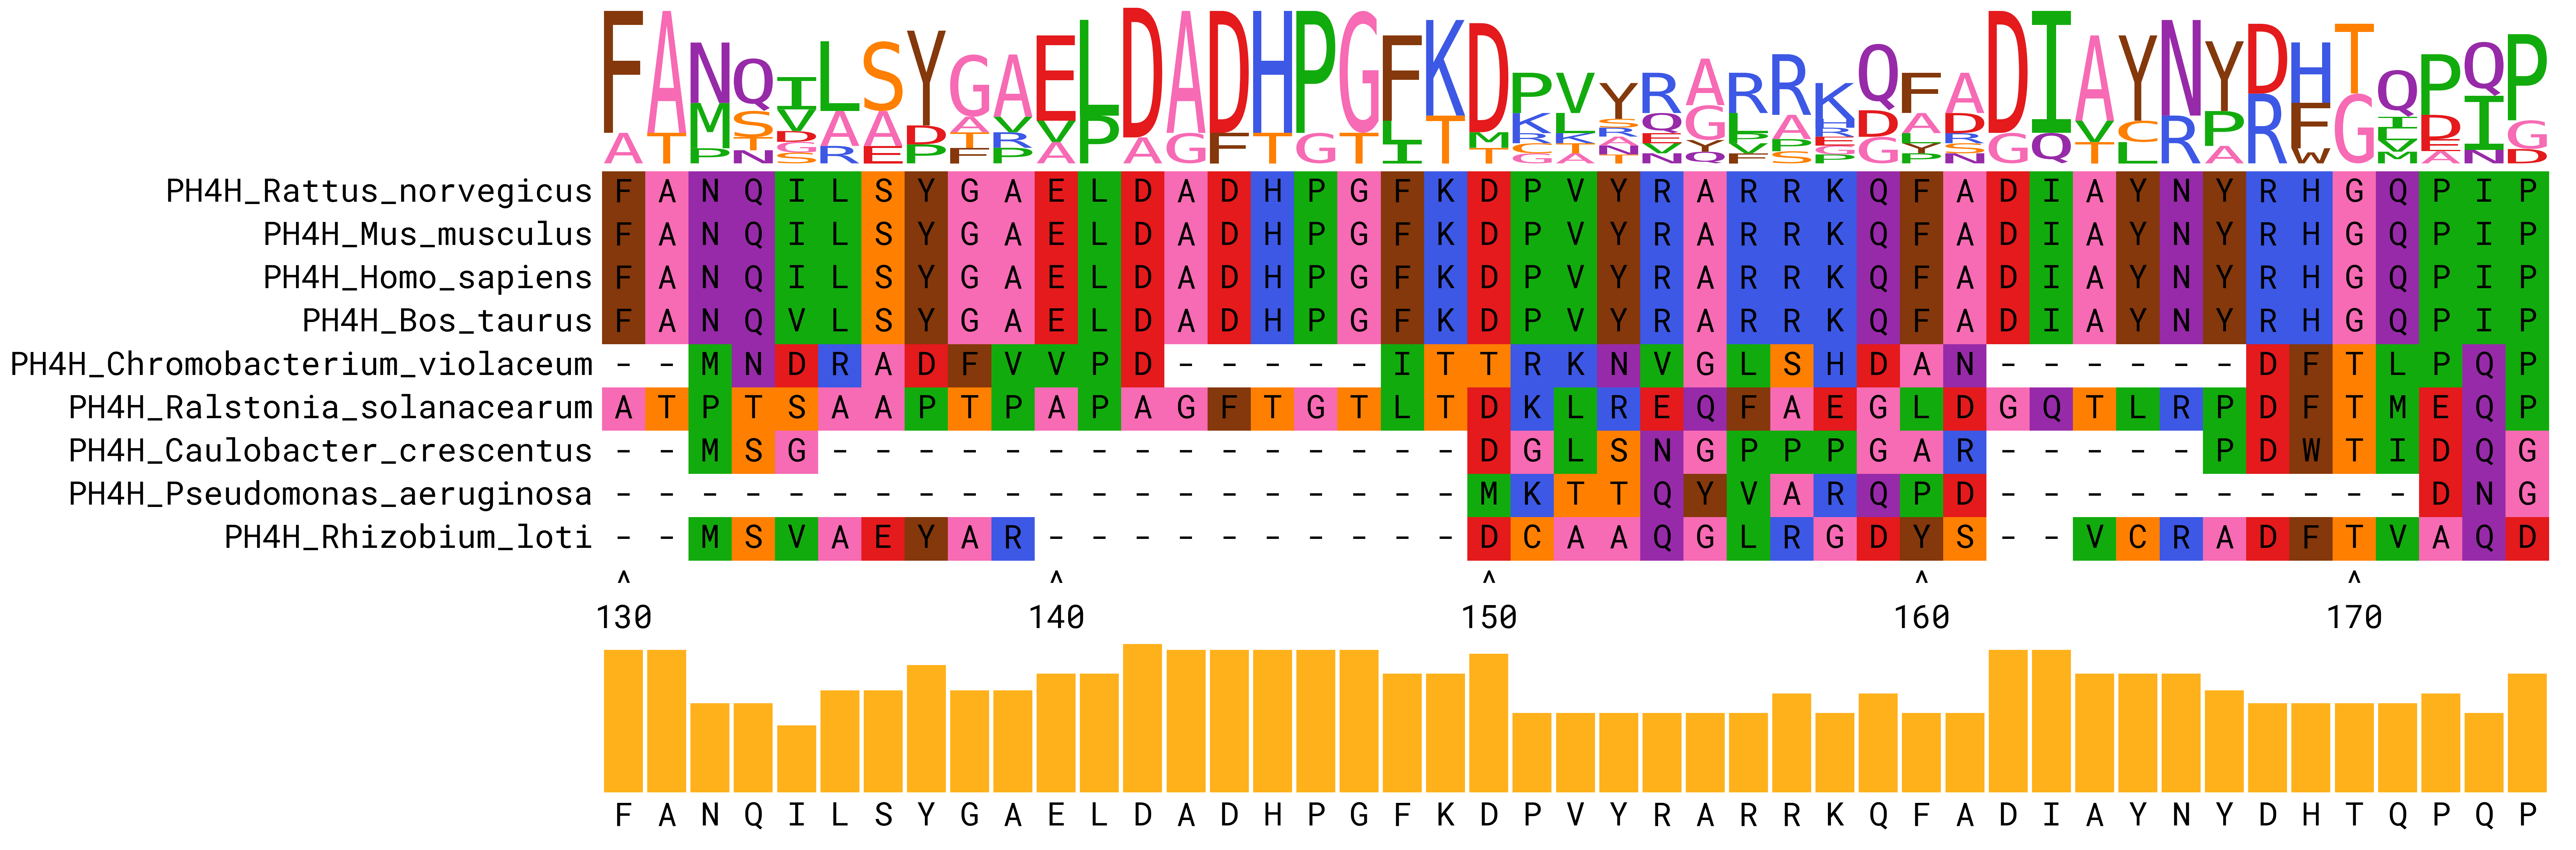
Sequence Alignment Plot#
from collections import Counter
import numpy as np
import pandas as pd

import marsilea as ma
import matplotlib as mpl
Load data#
seq = ma.load_data("seq_align")
seq = seq.iloc[:, 130:175]
Calculate the height of each amino acid. See https://en.wikipedia.org/wiki/Sequence_logo
collect = []
for _, col in seq.items():
    collect.append(Counter(col))

hm = pd.DataFrame(collect)
del hm["-"]
hm = hm.T.fillna(0.0)
hm.columns = seq.columns
hm /= hm.sum(axis=0)

n = hm.shape[1]
s = 20
En = (1 / np.log(2)) * ((s - 1) / (2 * n))

heights = []
for _, col in hm.items():
    H = -(np.log2(col) * col).sum()
    R = np.log2(20) - (H + En)
    heights.append(col * R)

logo = pd.DataFrame(heights).T
/home/docs/checkouts/readthedocs.org/user_builds/marsilea/envs/v0.4.4/lib/python3.10/site-packages/pandas/core/arraylike.py:399: RuntimeWarning: divide by zero encountered in log2
  result = getattr(ufunc, method)(*inputs, **kwargs)
Prepare color palette and data#
color_encode = {
    "A": "#f76ab4",
    "C": "#ff7f00",
    "D": "#e41a1c",
    "E": "#e41a1c",
    "F": "#84380b",
    "G": "#f76ab4",
    "H": "#3c58e5",
    "I": "#12ab0d",
    "K": "#3c58e5",
    "L": "#12ab0d",
    "M": "#12ab0d",
    "N": "#972aa8",
    "P": "#12ab0d",
    "Q": "#972aa8",
    "R": "#3c58e5",
    "S": "#ff7f00",
    "T": "#ff7f00",
    "V": "#12ab0d",
    "W": "#84380b",
    "Y": "#84380b",
    "-": "white",
}

max_aa = []
freq = []

for _, col in hm.items():
    ix = np.argmax(col)
    max_aa.append(hm.index[ix])
    freq.append(col[ix])

position = []
mock_ticks = []
for i in seq.columns:
    if int(i) % 10 == 0:
        position.append(i)
        mock_ticks.append("^")
    else:
        position.append("")
        mock_ticks.append("")
/home/docs/checkouts/readthedocs.org/user_builds/marsilea/checkouts/v0.4.4/docs/examples/Gallery/plot_seqalign.py:86: FutureWarning: Series.__getitem__ treating keys as positions is deprecated. In a future version, integer keys will always be treated as labels (consistent with DataFrame behavior). To access a value by position, use `ser.iloc[pos]`
  freq.append(col[ix])
Plot#
height = 5
width = height * seq.shape[1] / seq.shape[0]

ch = ma.CatHeatmap(seq.to_numpy(), palette=color_encode, height=height, width=width)
ch.add_layer(ma.plotter.TextMesh(seq.to_numpy()))
ch.add_top(ma.plotter.SeqLogo(logo, color_encode=color_encode), pad=0.1, size=2)
ch.add_left(ma.plotter.Labels(seq.index), pad=0.1)
ch.add_bottom(ma.plotter.Labels(mock_ticks, rotation=0), pad=0.1)
ch.add_bottom(ma.plotter.Labels(position, rotation=0))
ch.add_bottom(
    ma.plotter.Numbers(freq, width=0.9, color="#FFB11B", show_value=False),
    name="freq_bar",
    size=2,
)
ch.add_bottom(ma.plotter.Labels(max_aa, rotation=0), pad=0.1)
ch.render()

ch.get_ax("freq_bar").set_axis_off()
Total running time of the script: (0 minutes 11.505 seconds)