marsilea.plotter.MarkerMesh#
- class marsilea.plotter.MarkerMesh(data, color='black', marker='*', size=35, label=None, label_loc=None, props=None, **kwargs)#
Bases:
MeshBaseThe mesh that draw marker shape
- Parameters:
- datanp.ndarray
Must be bool matrix to indicate if a marker is drawn at specific cell
- colorcolor
The color of the marker.
- markerstr
- sizeint
The of marker in fontsize unit
- labelstr
The label of the plot, only show when added to the side plot
- label_locstr
The position of the label
- propsdict
- kwargs
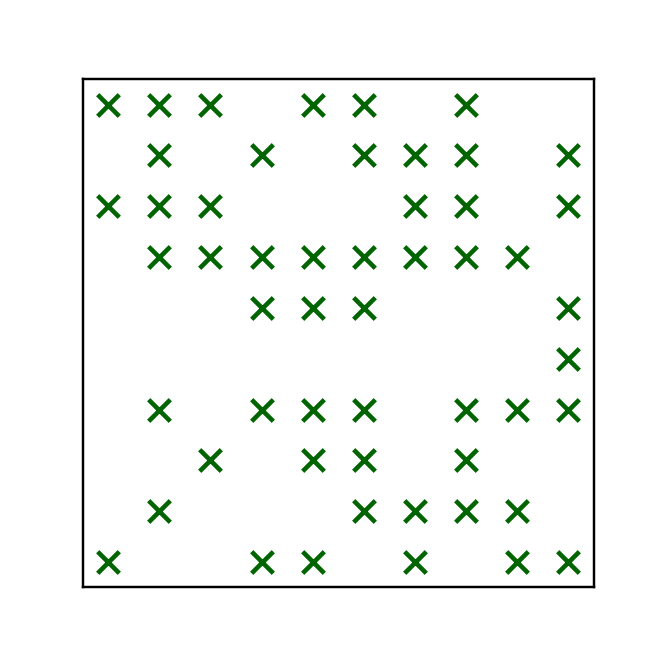
Examples
>>> from marsilea.plotter import MarkerMesh
>>> data = np.random.randn(10, 10) > 0
>>> _, ax = plt.subplots(figsize=(3, 3))
>>> MarkerMesh(data, color="darkgreen", marker="x", size=50).render(ax)
- render_main = True#