marsilea.plotter.Colors#
- class marsilea.plotter.Colors(data, palette=None, cmap=None, mask=None, linewidth=None, linecolor=None, label=None, label_loc=None, props=None, legend_kws=None, **kwargs)#
Bases:
MeshBaseCategorical colors/heatmap
- Parameters:
- datanp.ndarray
- labelstr
- label_loc{‘top’, ‘bottom’, ‘left’, ‘right’}
- palettedict, array-like
Could be a mapping of label and colors or an array match the shape of data
- cmapstr or
matplotlib.colors.Colormap The colormap used to map the value to the color
- maskarray of bool
Indicate which cell will be masked and not rendered
- labelstr
The label of the plot, only show if added to the side plot
- label_locstr
Where to add the label
- propsdict
- legend_kws
See
legendkit.legend- kwargs
Pass to
pcolormesh
See also
Examples
>>> import marsilea as ma
>>> from marsilea.plotter import Colors
>>> _, ax = plt.subplots(figsize=(5, .5))
>>> data = np.random.choice(["A", "B", "C"], 10)
>>> Colors(data).render(ax)

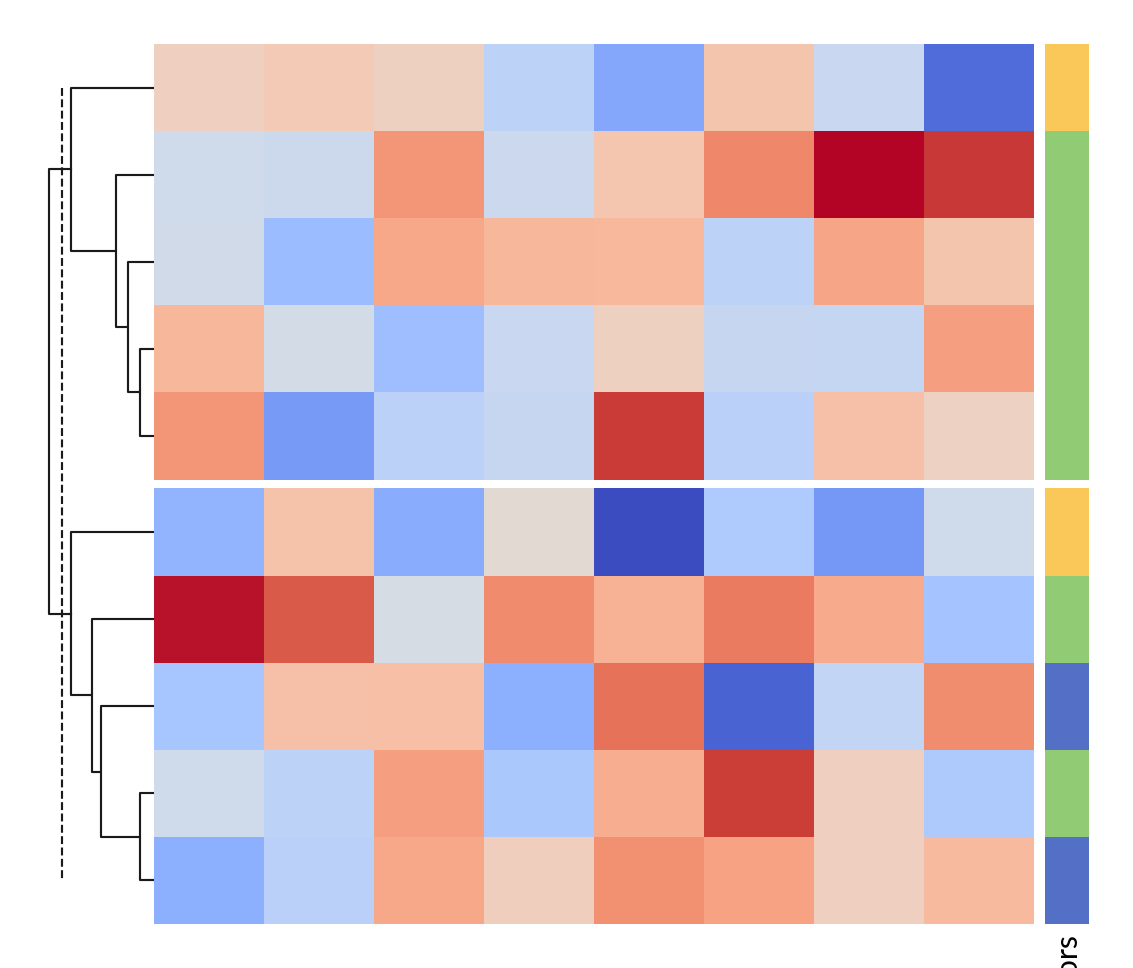
>>> h = ma.Heatmap(np.random.randn(10, 8))
>>> h.hsplit(cut=[5])
>>> h.add_dendrogram("left")
>>> color = Colors(data, label="Colors")
>>> h.add_right(color, size=.2, pad=.05)
>>> h.render()