marsilea.plotter.CenterBar#
- class marsilea.plotter.CenterBar(data, names=None, width=0.8, colors=None, orient=None, show_value=True, fmt=None, label=None, value_pad=2.0, props=None, **kwargs)#
Bases:
_BarBaseTwo comparable bar plots with center line
- Parameters:
- datanp.ndarray, pd.DataFrame
If input with array, must be 2D array with shape (n, 2). If input with DataFrame, must have two columns.
- nameslist of str
The names of the two bars
- widthfloat
The width of bar
- colorslist of color
The colors of the two bars
- orient{“v”, “h”}
The orientation of the plot
- show_valuebool
Whether to show value on the bar
- fmtstr, callable
Format the value show on the bar
- labelstr
The label of the plot
- value_padfloat
The spacing between value and the plot
- propsdict
- kwargs:
Other keyword arguments passed to
matplotlib.axes.Axes.bar()
Examples
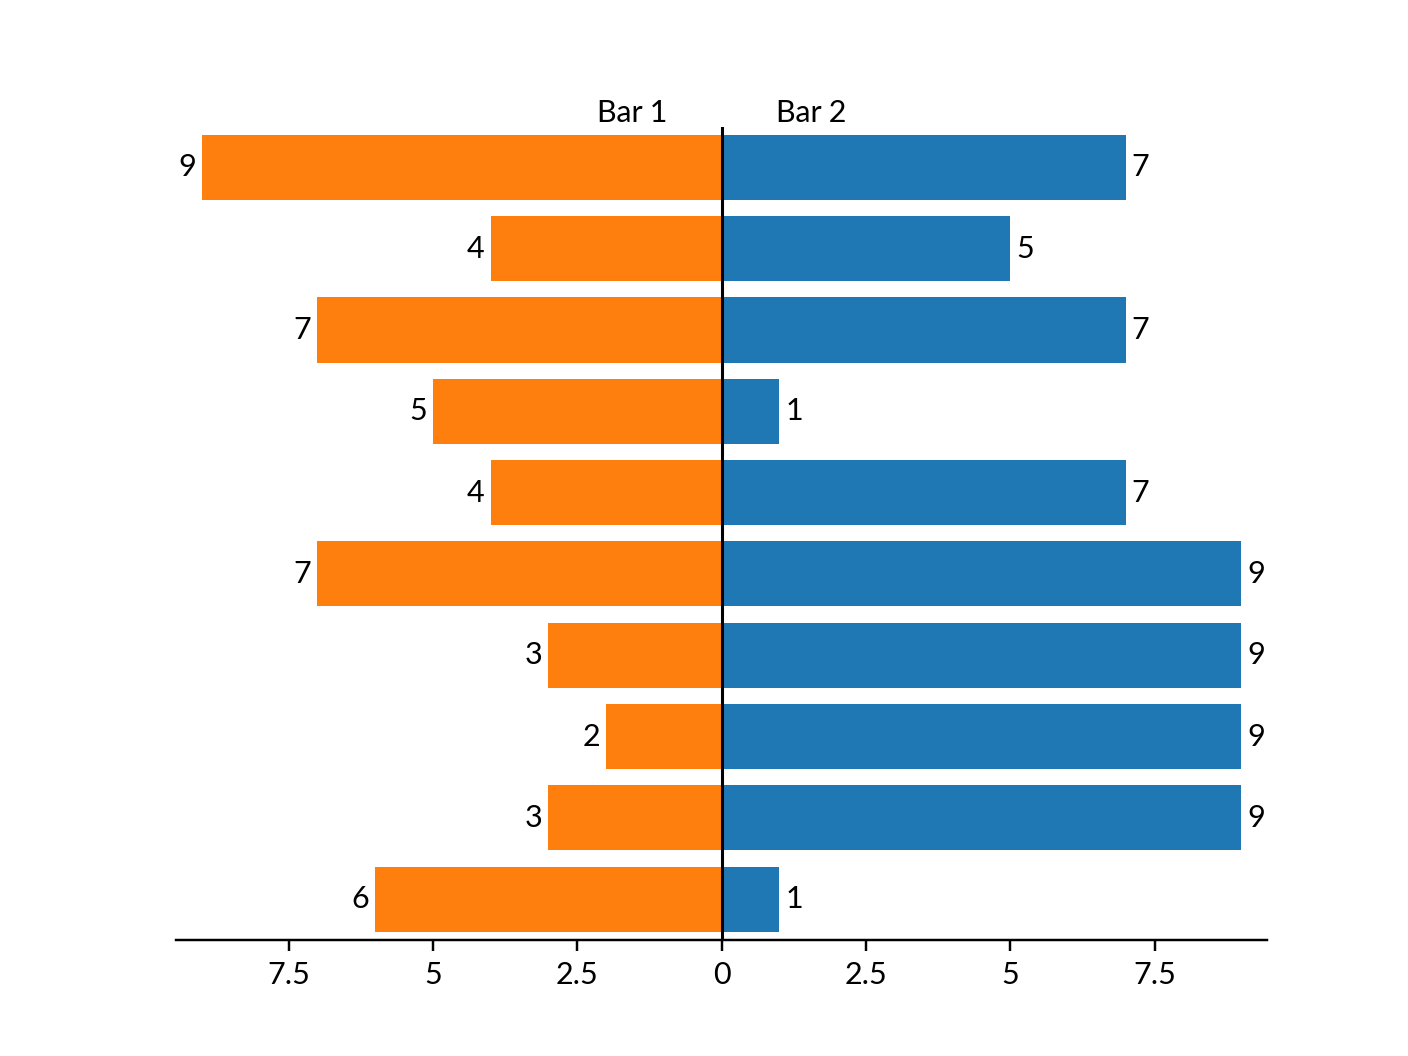
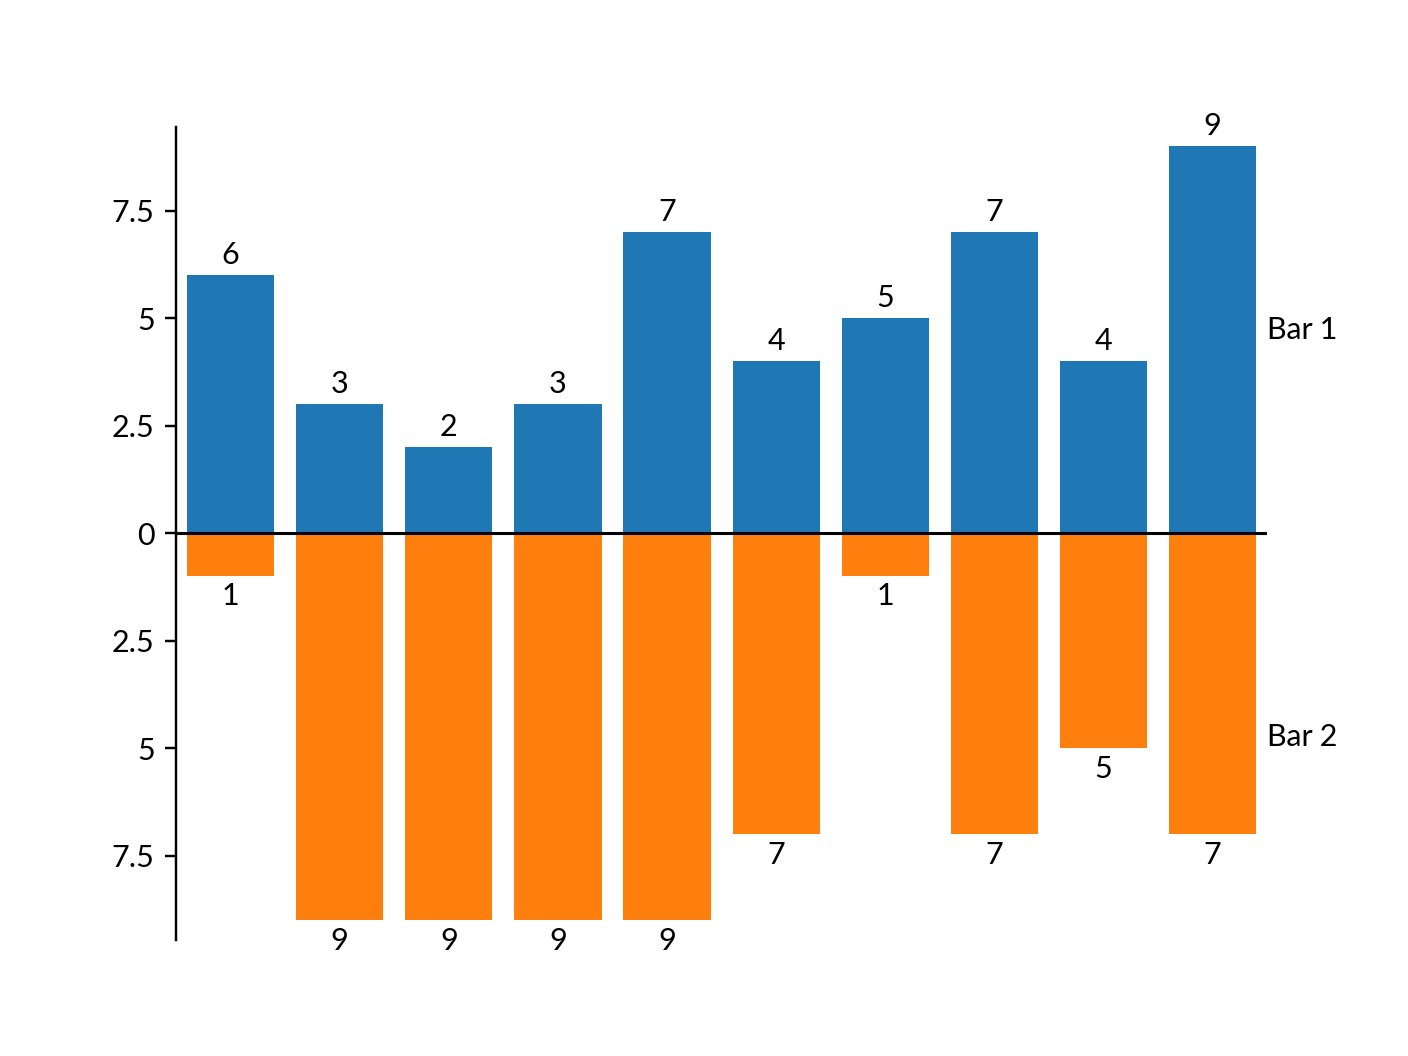
>>> import marsilea as ma
>>> from marsilea.plotter import CenterBar
>>> data = np.random.randint(1, 10, (10, 2))
>>> _, ax = plt.subplots()
>>> CenterBar(data, names=["Bar 1", "Bar 2"]).render(ax)
>>> _, ax = plt.subplots()
>>> CenterBar(data, names=["Bar 1", "Bar 2"], orient="h").render(ax)