marsilea.plotter.Arc#
- class marsilea.plotter.Arc(anchors, links, weights=None, width=None, colors=None, labels=None, legend_kws=None, label=None, label_loc=None, props=None, **kwargs)#
Bases:
StatsBaseArc diagram.
- Parameters:
- anchorsarray-like
Anchors of the arcs.
- linksarray-like
Links of the arcs.
- weightsarray-like, optional
Weights of the links. If not specified, all links will have the same width.
- widthfloat or tuple of float, optional
Width of the links. If weights is specified, width must be a tuple of two floats, where the first float is the minimum width and the second float is the maximum width. If weights is not specified, width must be a float.
- colorsstr or array-like, optional
Colors of the links. If not specified, all links will have the same color.
- labelsarray-like, optional
Labels of the links. If not specified, no legend will be shown.
- legend_kwsdict, optional
Keyword arguments passed to legendkit.cat_legend.
- labelstr, optional
Label of the plot.
- label_locstr, optional
Location of the label. Must be one of the following: “left”, “right”, “top”, “bottom”, “center”.
- propsdict, optional
Keyword arguments passed to matplotlib.text.Text.
- **kwargs
Keyword arguments passed to matplotlib.patches.Arc.
Examples
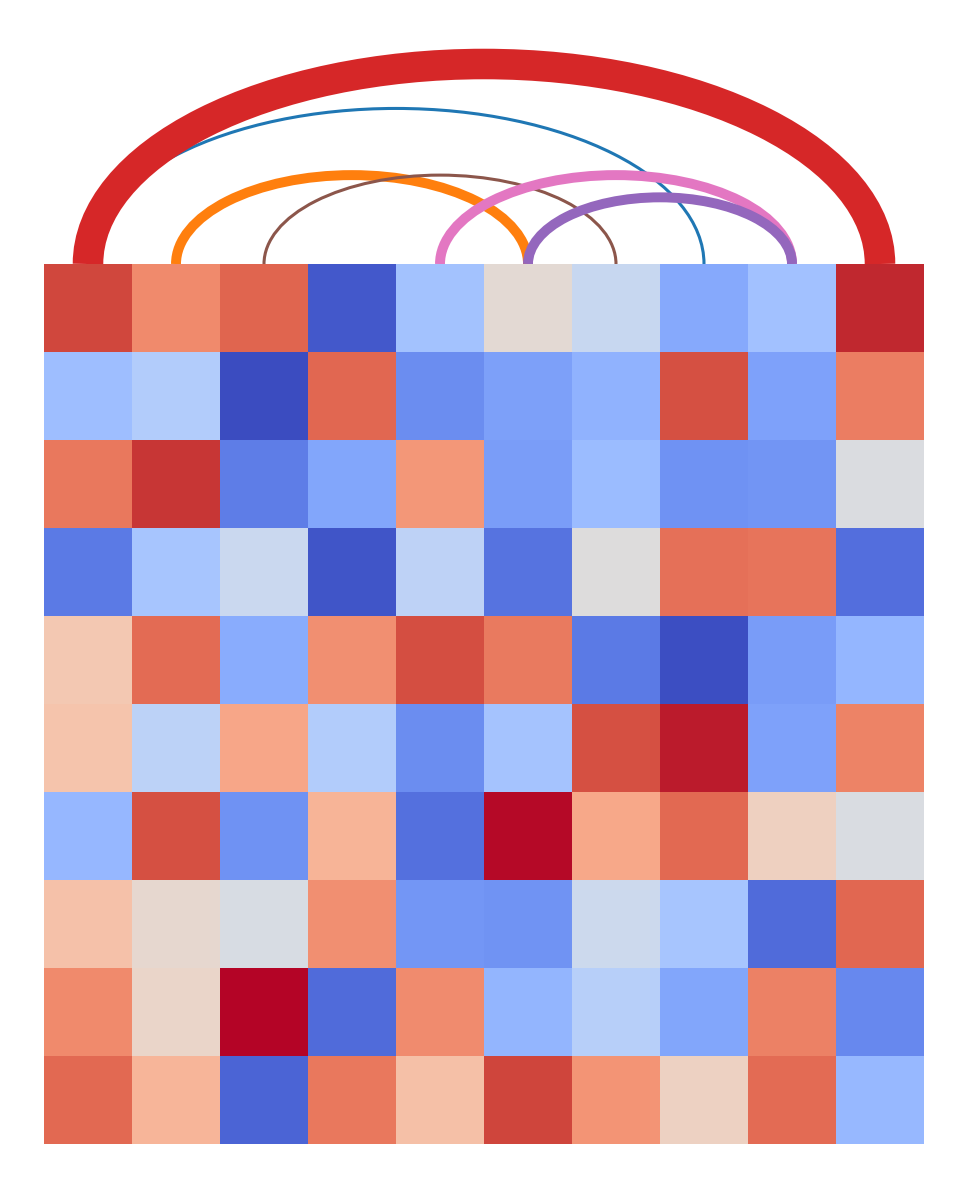
>>> import marsilea as ma
>>> from marsilea.plotter import Arc
>>> anchors = np.arange(10)
>>> links = [(0, 7), (1, 5), (3, 10), (0, 9), (5, 8), (2, 6), (4, 8)]
>>> weights = [1, 2, 3, 5, 2, 1, 2]
>>> colors = ["C0", "C1", "C2", "C3", "C4", "C5", "C6"]
>>> labels = ["A", "B", "C", "D", "E", "F", "G"]
>>> h = ma.Heatmap(np.random.rand(10, 10))
>>> h.add_top(Arc(anchors, links, weights=weights,
...               colors=colors, labels=labels))
>>> h.render()
- render_main = False#