
Note
Go to the end to download the full example code.
Significance annotation in Python (p-value brackets)#
Test pairs of categories and draw the result on a seaborn plotter with
annotate_stats. This needs the
optional statannotations
dependency:
pip install marsilea[stats]
import numpy as np
import pandas as pd

import marsilea as ma
import marsilea.plotter as mp
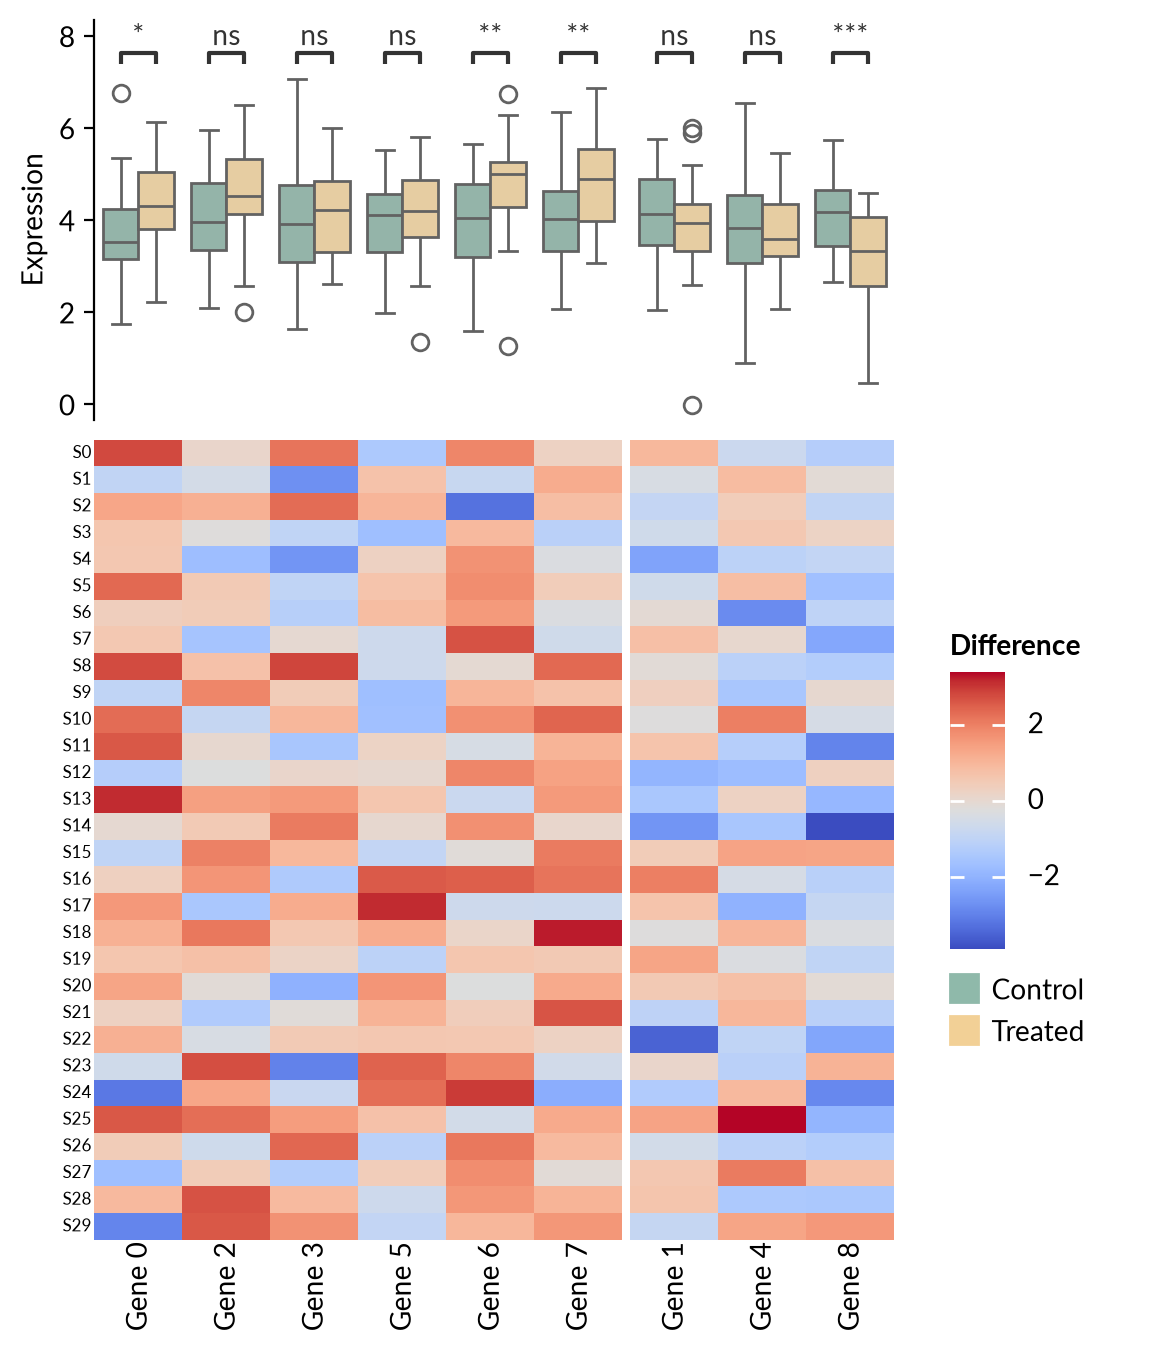
Expression of 9 genes in two conditions, measured over 30 samples.
rng = np.random.default_rng(0)
genes = [f"Gene {i}" for i in range(9)]
effect = rng.normal(0, 0.8, len(genes))

expression = pd.DataFrame(rng.normal(4, 1, (30, len(genes))), columns=genes)
treated = pd.DataFrame(rng.normal(4, 1, (30, len(genes))) + effect, columns=genes)
pairs="hue" compares the conditions inside every gene. The categories are
named with the columns of the input, so the annotation follows the data
wherever grouping and clustering move it.
box = mp.Box(
    {"Control": expression, "Treated": treated},
    palette={"Control": "#8FB9AA", "Treated": "#F2D096"},
    label="Expression",
)
box.annotate_stats(
    pairs="hue",
    test="Mann-Whitney",
    text_format="star",
    comparisons_correction="Benjamini-Hochberg",
)

h = ma.Heatmap(treated.values - expression.values, label="Difference")
h.group_cols(np.where(effect > 0, "Up", "Down"), order=["Up", "Down"])
h.add_top(box, size=2, pad=0.1)
h.add_bottom(mp.Labels(genes))
h.add_left(mp.Labels([f"S{i}" for i in range(30)], fontsize=6))
h.add_legends()
h.render()
<marsilea.heatmap.Heatmap object at 0x77c5958cec60>
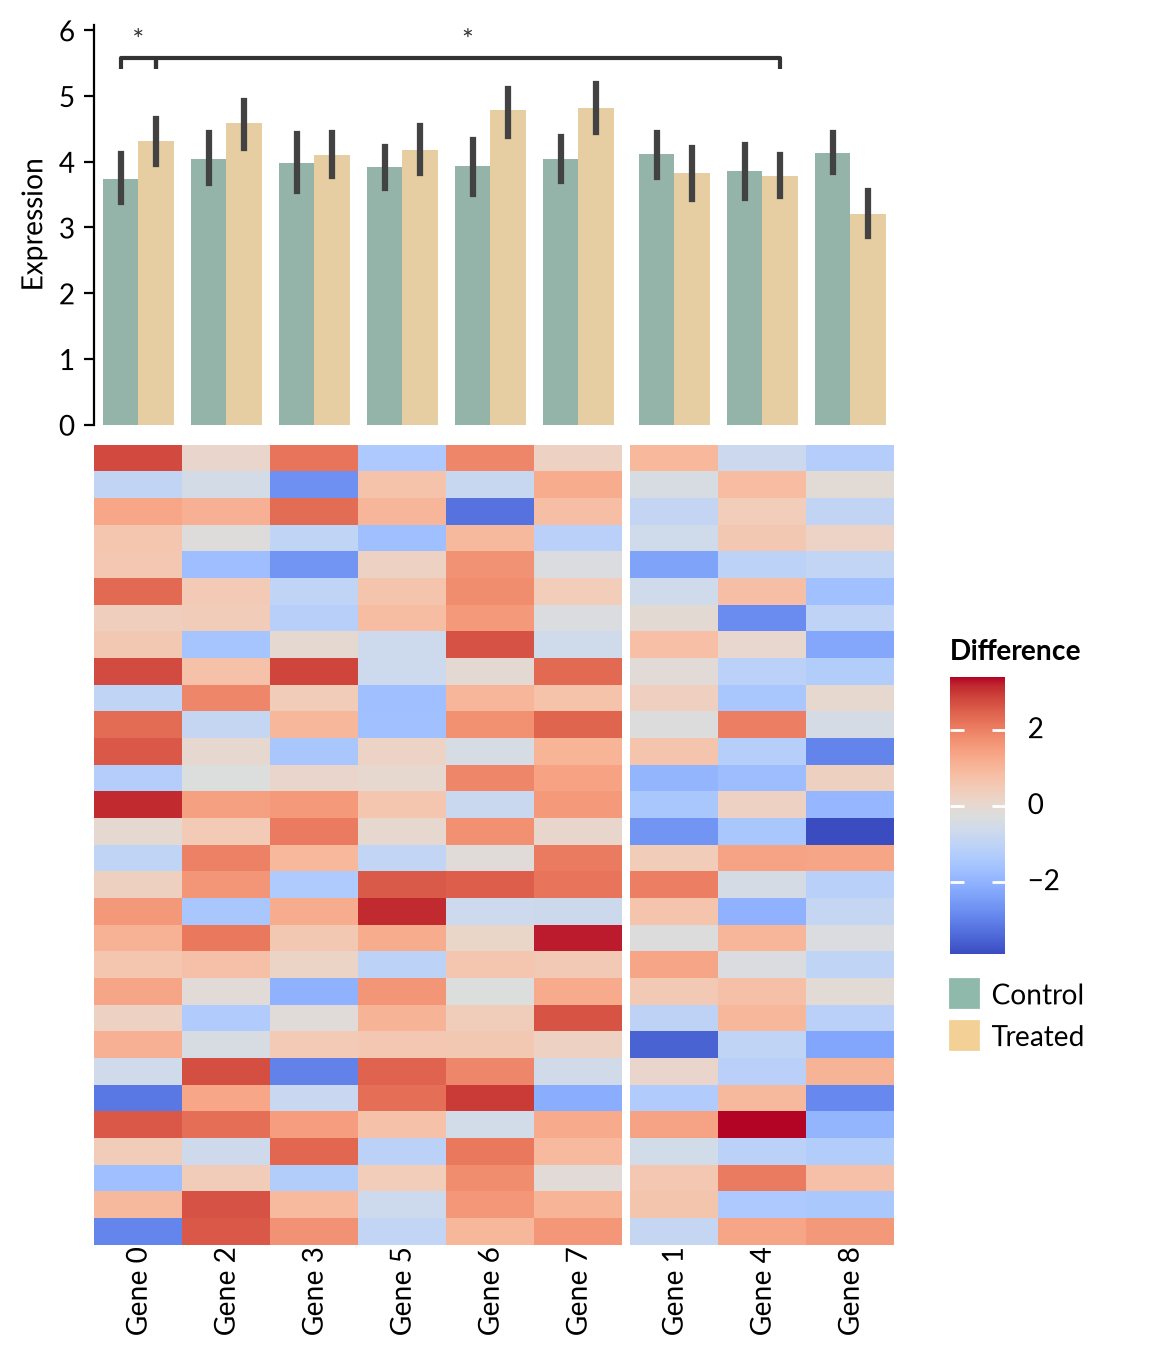
Listing the pairs explicitly annotates only the comparisons you care about, and a pair may span two groups. Each group is drawn on its own axes, so those brackets are placed in figure coordinates, above the within-group ones they pass over.
bar = mp.Bar(
    {"Control": expression, "Treated": treated},
    palette={"Control": "#8FB9AA", "Treated": "#F2D096"},
    label="Expression",
)
bar.annotate_stats(
    pairs=[
        (("Gene 0", "Control"), ("Gene 0", "Treated")),
        (("Gene 0", "Treated"), ("Gene 4", "Treated")),
    ],
    test="t-test_ind",
    text_format="star",
)

h = ma.Heatmap(treated.values - expression.values, label="Difference")
h.group_cols(np.where(effect > 0, "Up", "Down"), order=["Up", "Down"])
h.add_top(bar, size=2, pad=0.1)
h.add_bottom(mp.Labels(genes))
h.add_legends()
h.render()
<marsilea.heatmap.Heatmap object at 0x77c595bb1220>
Total running time of the script: (0 minutes 2.090 seconds)