Ctrl+K
marsilea 0.8.1 documentation - Home marsilea 0.8.1 documentation - Home
  • Tutorial
  • Gallery
  • API
  • Installation
  • How-To
  • AI Assistants
  • GitHub
  • Tutorial
  • Gallery
  • API
  • Installation
  • How-To
  • AI Assistants
  • GitHub

Section Navigation

  • Basics
    • Complex annotated heatmap in Python
    • Heatmap in Python
    • Stacked bar chart in Python
    • Two heatmaps side by side in Python
  • All Plotters
    • AnnoLabels
    • Arc
    • Area
    • Bar
    • Box
    • Boxen
    • CenterBar
    • Chunk
    • ColorMesh
    • Colors
    • Emoji
    • FixedChunk
    • Image
    • Labels
    • MarkerMesh
    • Numbers
    • Point
    • Range
    • Sequence logo in Python
    • SizedMesh
    • StackBar
    • Strip
    • Swarm
    • TextMesh
    • Title
    • Violin
  • Real World Data Visualization
    • Arc diagram in Python: Les Misérables network
    • Current available plotters in Marsilea
    • Bivariate distribution plot in Python (joint plot with marginals)
    • Spatial map annotation in Python: mouse embryo
    • Cross-layout stacked bar chart in Python: fat in cooking oils
    • Oncoprint in Python: TCGA breast cancer mutations
    • Single-cell RNA-seq heatmap in Python (PBMC 3k)
    • Single-cell multi-omics figure in Python
    • Sequence alignment plot in Python (MSA)
    • Significance annotation in Python (p-value brackets)
    • Bar chart with images in Python: TIOBE index
    • Genome track plot in Python
    • UpSet plot in Python: IMDB top 1000 movies
  • Gallery
  • Basics

Basics#

Complex annotated heatmap in Python

Complex annotated heatmap in Python

Heatmap in Python

Heatmap in Python

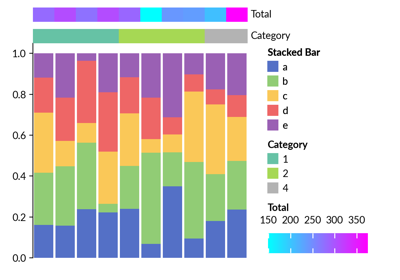
Stacked bar chart in Python

Stacked bar chart in Python

Two heatmaps side by side in Python

Two heatmaps side by side in Python

previous

Gallery

next

Complex annotated heatmap in Python

© Copyright 2026, Mr-Milk.

Created using Sphinx 9.1.0.

Built with the PyData Sphinx Theme 0.20.0.