Note
Go to the end to download the full example code.
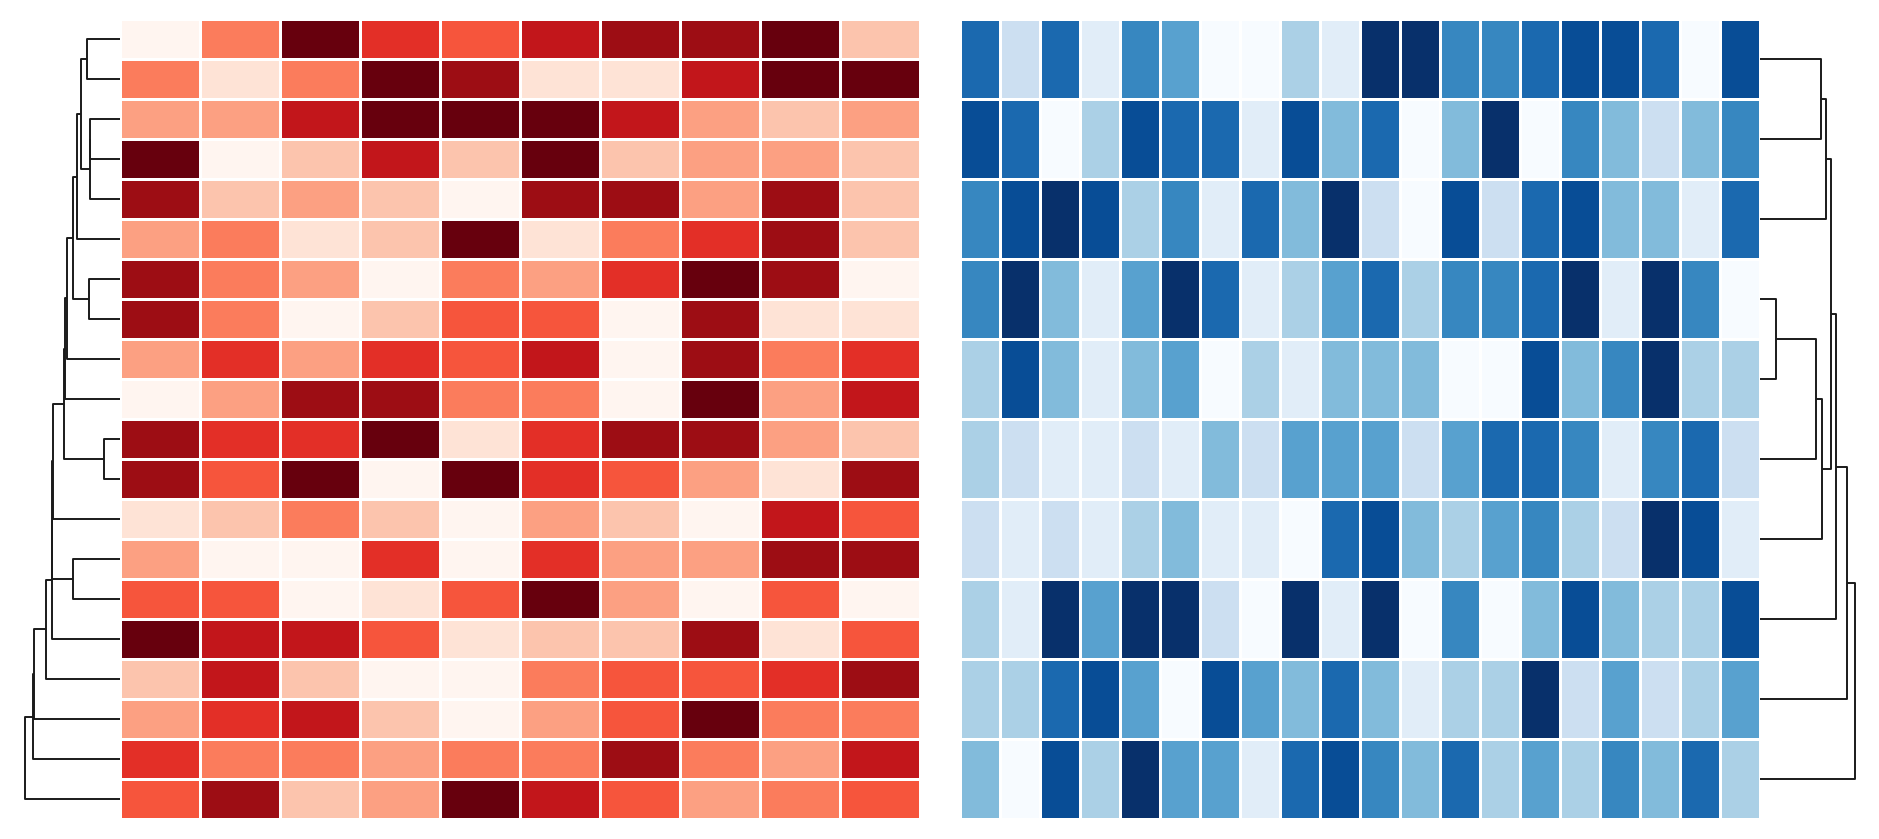
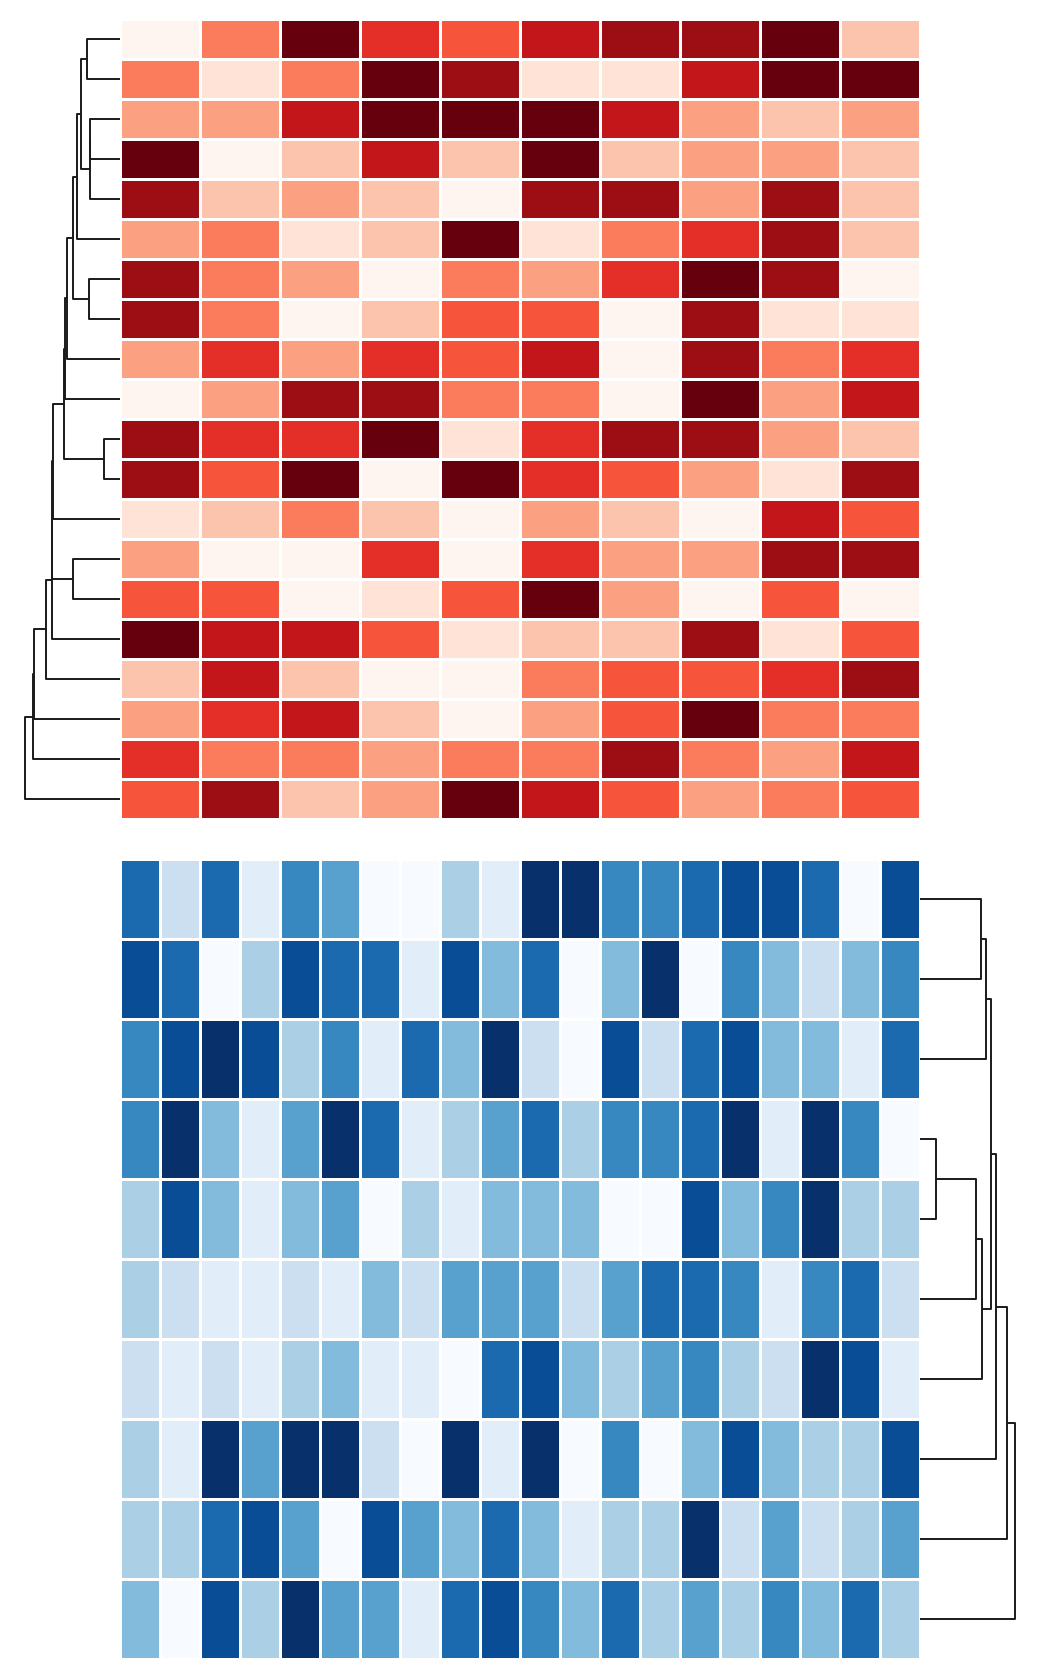
Two Heatmaps#
This example shows how to plot two heatmaps side by side.
import numpy as np
import marsilea as ma

data1 = np.random.randint(0, 10, (20, 10))
data2 = np.random.randint(0, 10, (10, 20))
h1 = ma.Heatmap(data1, linewidth=1, cmap="Reds", label="Heatmap 1")
h1.add_dendrogram("left")
h2 = ma.Heatmap(data2, linewidth=1, cmap="Blues", label="Heatmap 2")
h2.add_dendrogram("right")
(h1 + 0.2 + h2).render()
Total running time of the script: (0 minutes 0.724 seconds)