Ctrl+K
marsilea 0.4.8 documentation - Home marsilea 0.4.8 documentation - Home
  • Tutorial
  • Gallery
  • API
  • Installation
  • How-To
  • GitHub
  • Tutorial
  • Gallery
  • API
  • Installation
  • How-To
  • GitHub

Section Navigation

  • Basics
    • Grouped heatmap
    • Heatmap
    • Annotate stacked bar
    • Two Heatmaps
  • All Plotters
    • AnnoLabels
    • Arc
    • Area
    • Bar
    • Box
    • Boxen
    • CenterBar
    • Chunk
    • ColorMesh
    • Colors
    • Emoji
    • FixedChunk
    • Image
    • Labels
    • MarkerMesh
    • Numbers
    • Point
    • Range
    • SeqLogo
    • SizedMesh
    • StackBar
    • Strip
    • Swarm
    • TextMesh
    • Title
    • Violin
  • Real World Data Visualization
    • Les Miserables Arc Diagram
    • Current available plotters in Marsilea
    • Bivariate Distribution
    • Mouse Embryo Map
    • Fat content in cooking oils
    • Breast cancer mutation with Oncoprinter
    • Visualizing Single-cell RNA-seq Data
    • Visualizing Single-cell Multi-Omics Data
    • Sequence Alignment Plot
    • Ranking of programming languages.
    • Track Plot
    • Upset Plot
  • Gallery
  • Basics

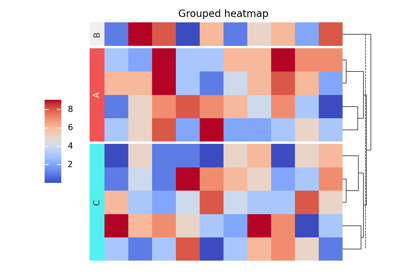
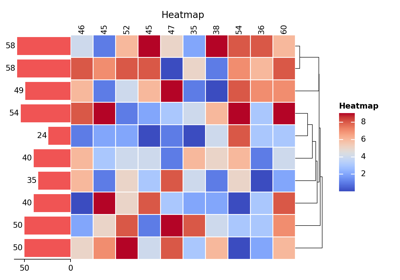
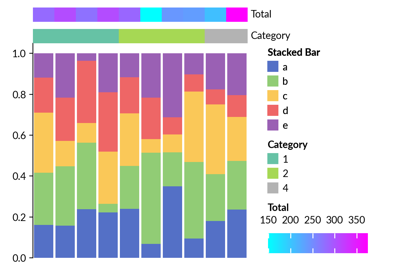
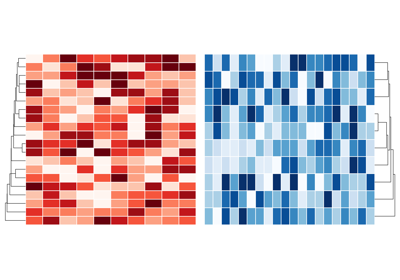
Basics#

Grouped heatmap

Grouped heatmap

Heatmap

Heatmap

Annotate stacked bar

Annotate stacked bar

Two Heatmaps

Two Heatmaps

previous

Gallery

next

Grouped heatmap

© Copyright 2024, Mr-Milk.

Created using Sphinx 8.1.3.

Built with the PyData Sphinx Theme 0.16.1.