API Reference#
Declarative API Cheat Sheet#
Operator |
Showcase |
Example |
|---|---|---|
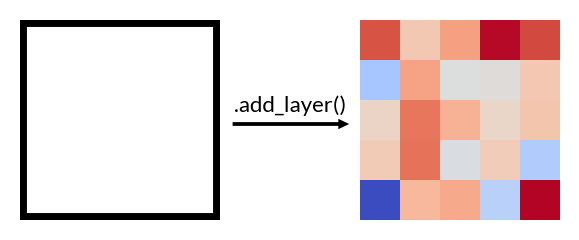
Add a plotter to main canvas.
|
|
wb.add_layer(ColorMesh(data))
|
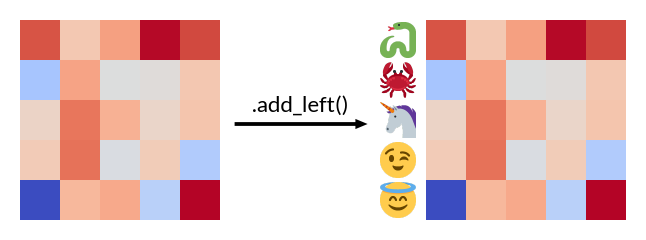
Add to the left-side of main canvas.
|
|
wb.add_left(Numbers(data),
            size=1, pad=.1,
            name='left-plot')
|
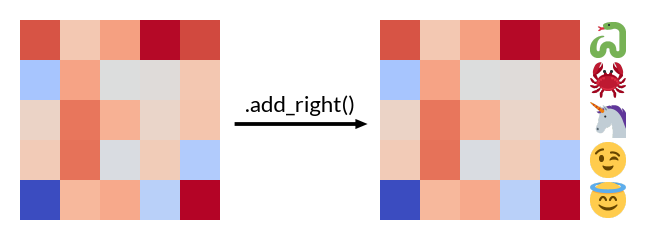
Add a plotter to the right-side of main canvas.
|
|
wb.add_right(Numbers(data))
|
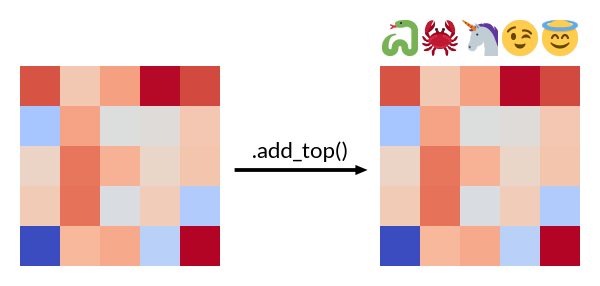
Add a plotter to the top-side of main canvas.
|
|
wb.add_top(Numbers(data))
|
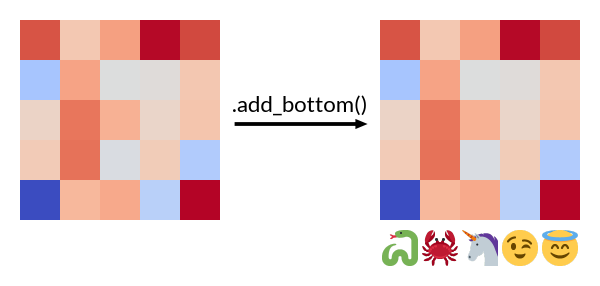
Add a plotter to the bottom-side of main canvas.
|
|
wb.add_bottom(Numbers(data))
|
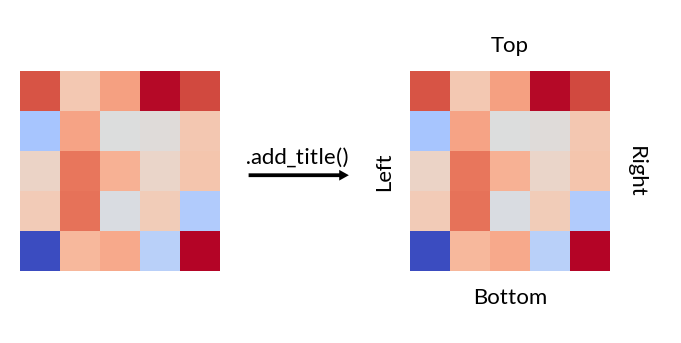
Add titles to the plot.
|
|
wb.add_title(top='Top', bottom='Bottom'
             left='Left', right='Right')
|
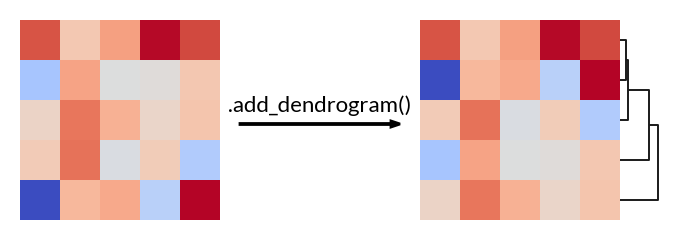
Add a dendrogram to the plot, only available to ClusterBoard.
|
|
cb.add_dendrogram("right")
|
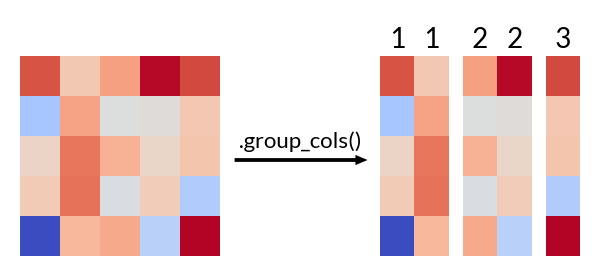
Split the main canvas vertically by labeling columns, only available to ClusterBoard.
|
|
cb.group_cols(list("11223"))
|
Split the main canvas horizontally by labeling rows, only available to ClusterBoard.
|

|
cb.group_rows(list("11223"))
|
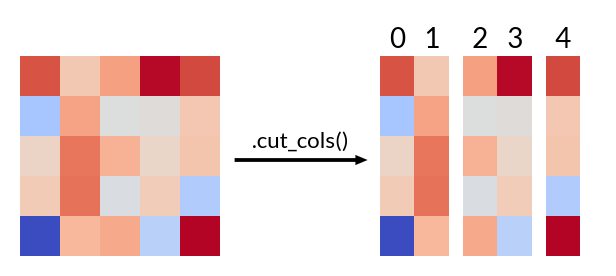
Split the main canvas vertically by positions, only available to ClusterBoard.
|
|
cb.cut_cols([2, 4])
|
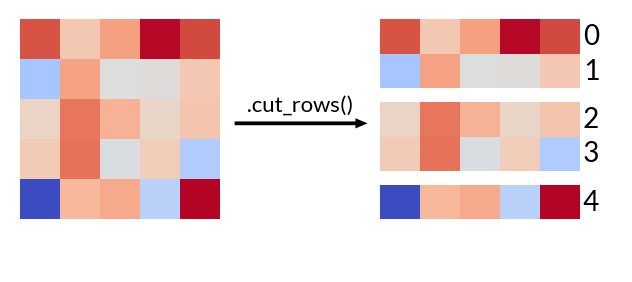
Split the main canvas horizontally by positions, only available to ClusterBoard.
|
|
cb.cut_rows([2, 4])
|
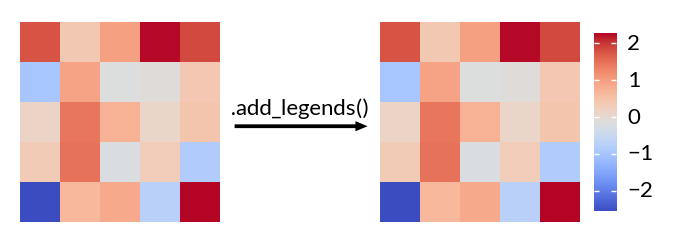
Add legends to the plots.
|
|
wb.add_legends()
|
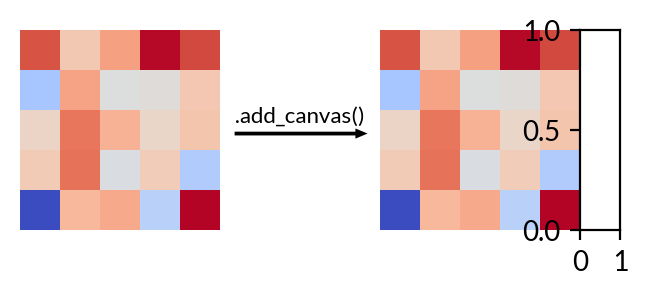
Add a empty canvas to a chosen side of main plot.
|
|
wb.add_canvas("right")
|
Add white space between plot.
|
— |
wb.add_pad("right", 1)
|
Add white space surrounding the figure.
|
— |
wb.set_margin(1)
|
Render the plot.
|
— |
wb.render()
|
Save the plot to a file.
|
— |
wb.save("output.png", dpi=300)
|
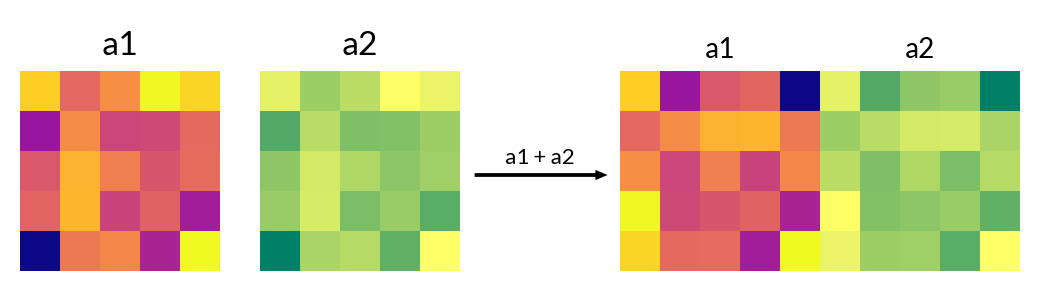
+Two canvas side by side, number will be added as white space
|
|
(wb1 + 1 + wb2).render()
|
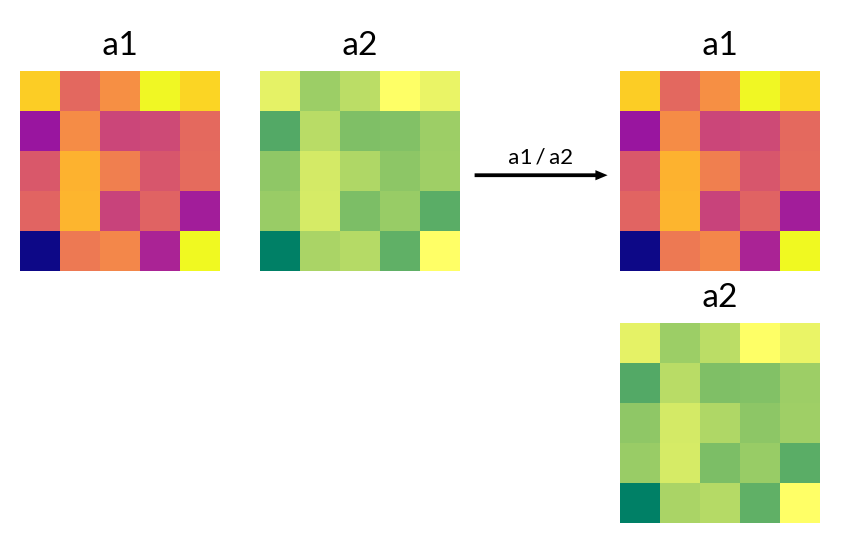
/Two canvas top and bottom, number will be added as white space
|
|
(wb1 / 1 / wb2).render()
|
High-Level Visualizations#
Heatmap Variants#
See |
|
Sized Heatmap |
|
Categorical Heatmap |
Layers Heatmap#
The mesh that draw customized elements in multi-layers |
UpSet plots#
OncoPrint#
OncoPrint plot |
Plotters#
Mesh#
Continuous Heatmap |
|
Categorical colors/heatmap |
|
Mesh for sized elements |
|
The mesh that draw marker shape |
|
The mesh that draw text on each cell |
Seaborn plots#
Other plots#
Text Label#
Add text labels |
|
Annotate a few rows or columns |
|
Add a title |
|
Mark groups |
|
Mark groups with fixed order |
Main Canvas#
The base class that handle all rendering process |
|
A main canvas class that can handle cluster data |
|
The factory class to handle legends |
|
A utility class to initialize a canvas with zero width |
|
A utility class to initialize a canvas with zero height |
|
A utility class to initialize a canvas with zero width and cluster data |
|
A utility class to initialize a canvas with zero height and cluster data |
Layout Engine#
The cross-layout engine |
|
A class to layout multiple Cross Layouts |
Data Manipulation#
A helper class to handle data |
Render plan#
The base class for every plotter in Marsilea |
|
The container class that holds the rendering data and parameters for each axes |
Datasets#
To load marsilea dataset |