marsilea.plotter.Range#
- class Range(data, items=None, marker='o', markersize=50, color1='#F75940', color2='#3DC7BE', edgecolor1='black', edgecolor2='black', edgewidth=1, linecolor='black', linewidth=1, label=None)#
Bases:
StatsBaseRange plot
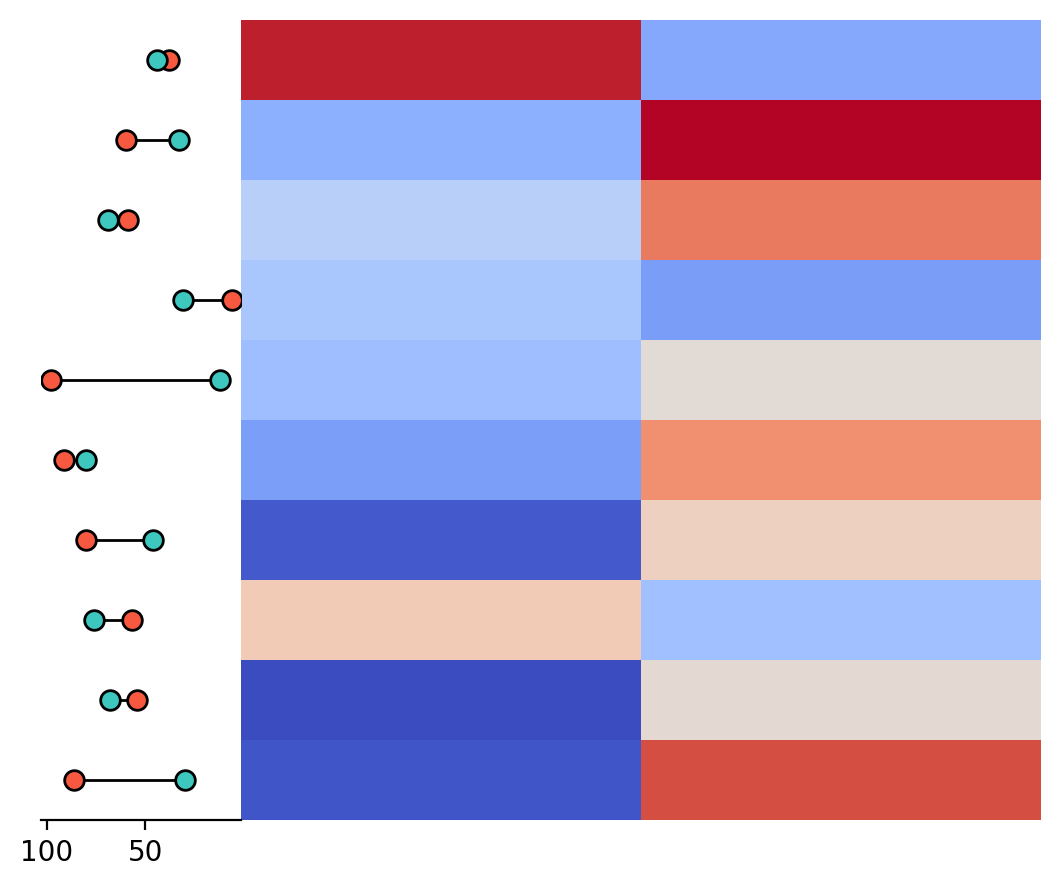
The range plot shows the range between two categories. The input data should be a DataFrame with two columns.
- Parameters:
- dataarray-like or DataFrame
The input data.
- itemsarray-like, default: None
The names of the items.
- markerstr, default: ‘o’
The marker style.
- markersizefloat, default: 50
The size of the marker.
- color1str, default: ‘#F75940’
The color of the first range.
- color2str, default: ‘#3DC7BE’
The color of the second range.
- edgecolor1str, default: ‘black’
The edge color of the first range.
- edgecolor2str, default: ‘black’
The edge color of the second range.
- edgewidthfloat, default: 1
The width of the edge.
- linecolorstr, default: ‘black’
The color of the line.
- linewidthfloat, default: 1
The width of the line.
- labelstr, default: None
The label of the plot.
Examples
>>> import marsilea as ma
>>> import numpy as np
>>> data = np.random.rand(10, 2)
>>> range_data = np.random.randint(1, 100, (10, 2))
>>> h = ma.Heatmap(data)
>>> h.add_left(ma.plotter.Range(range_data, items=["A", "B"]))
>>> h.render()