Note
Go to the end to download the full example code
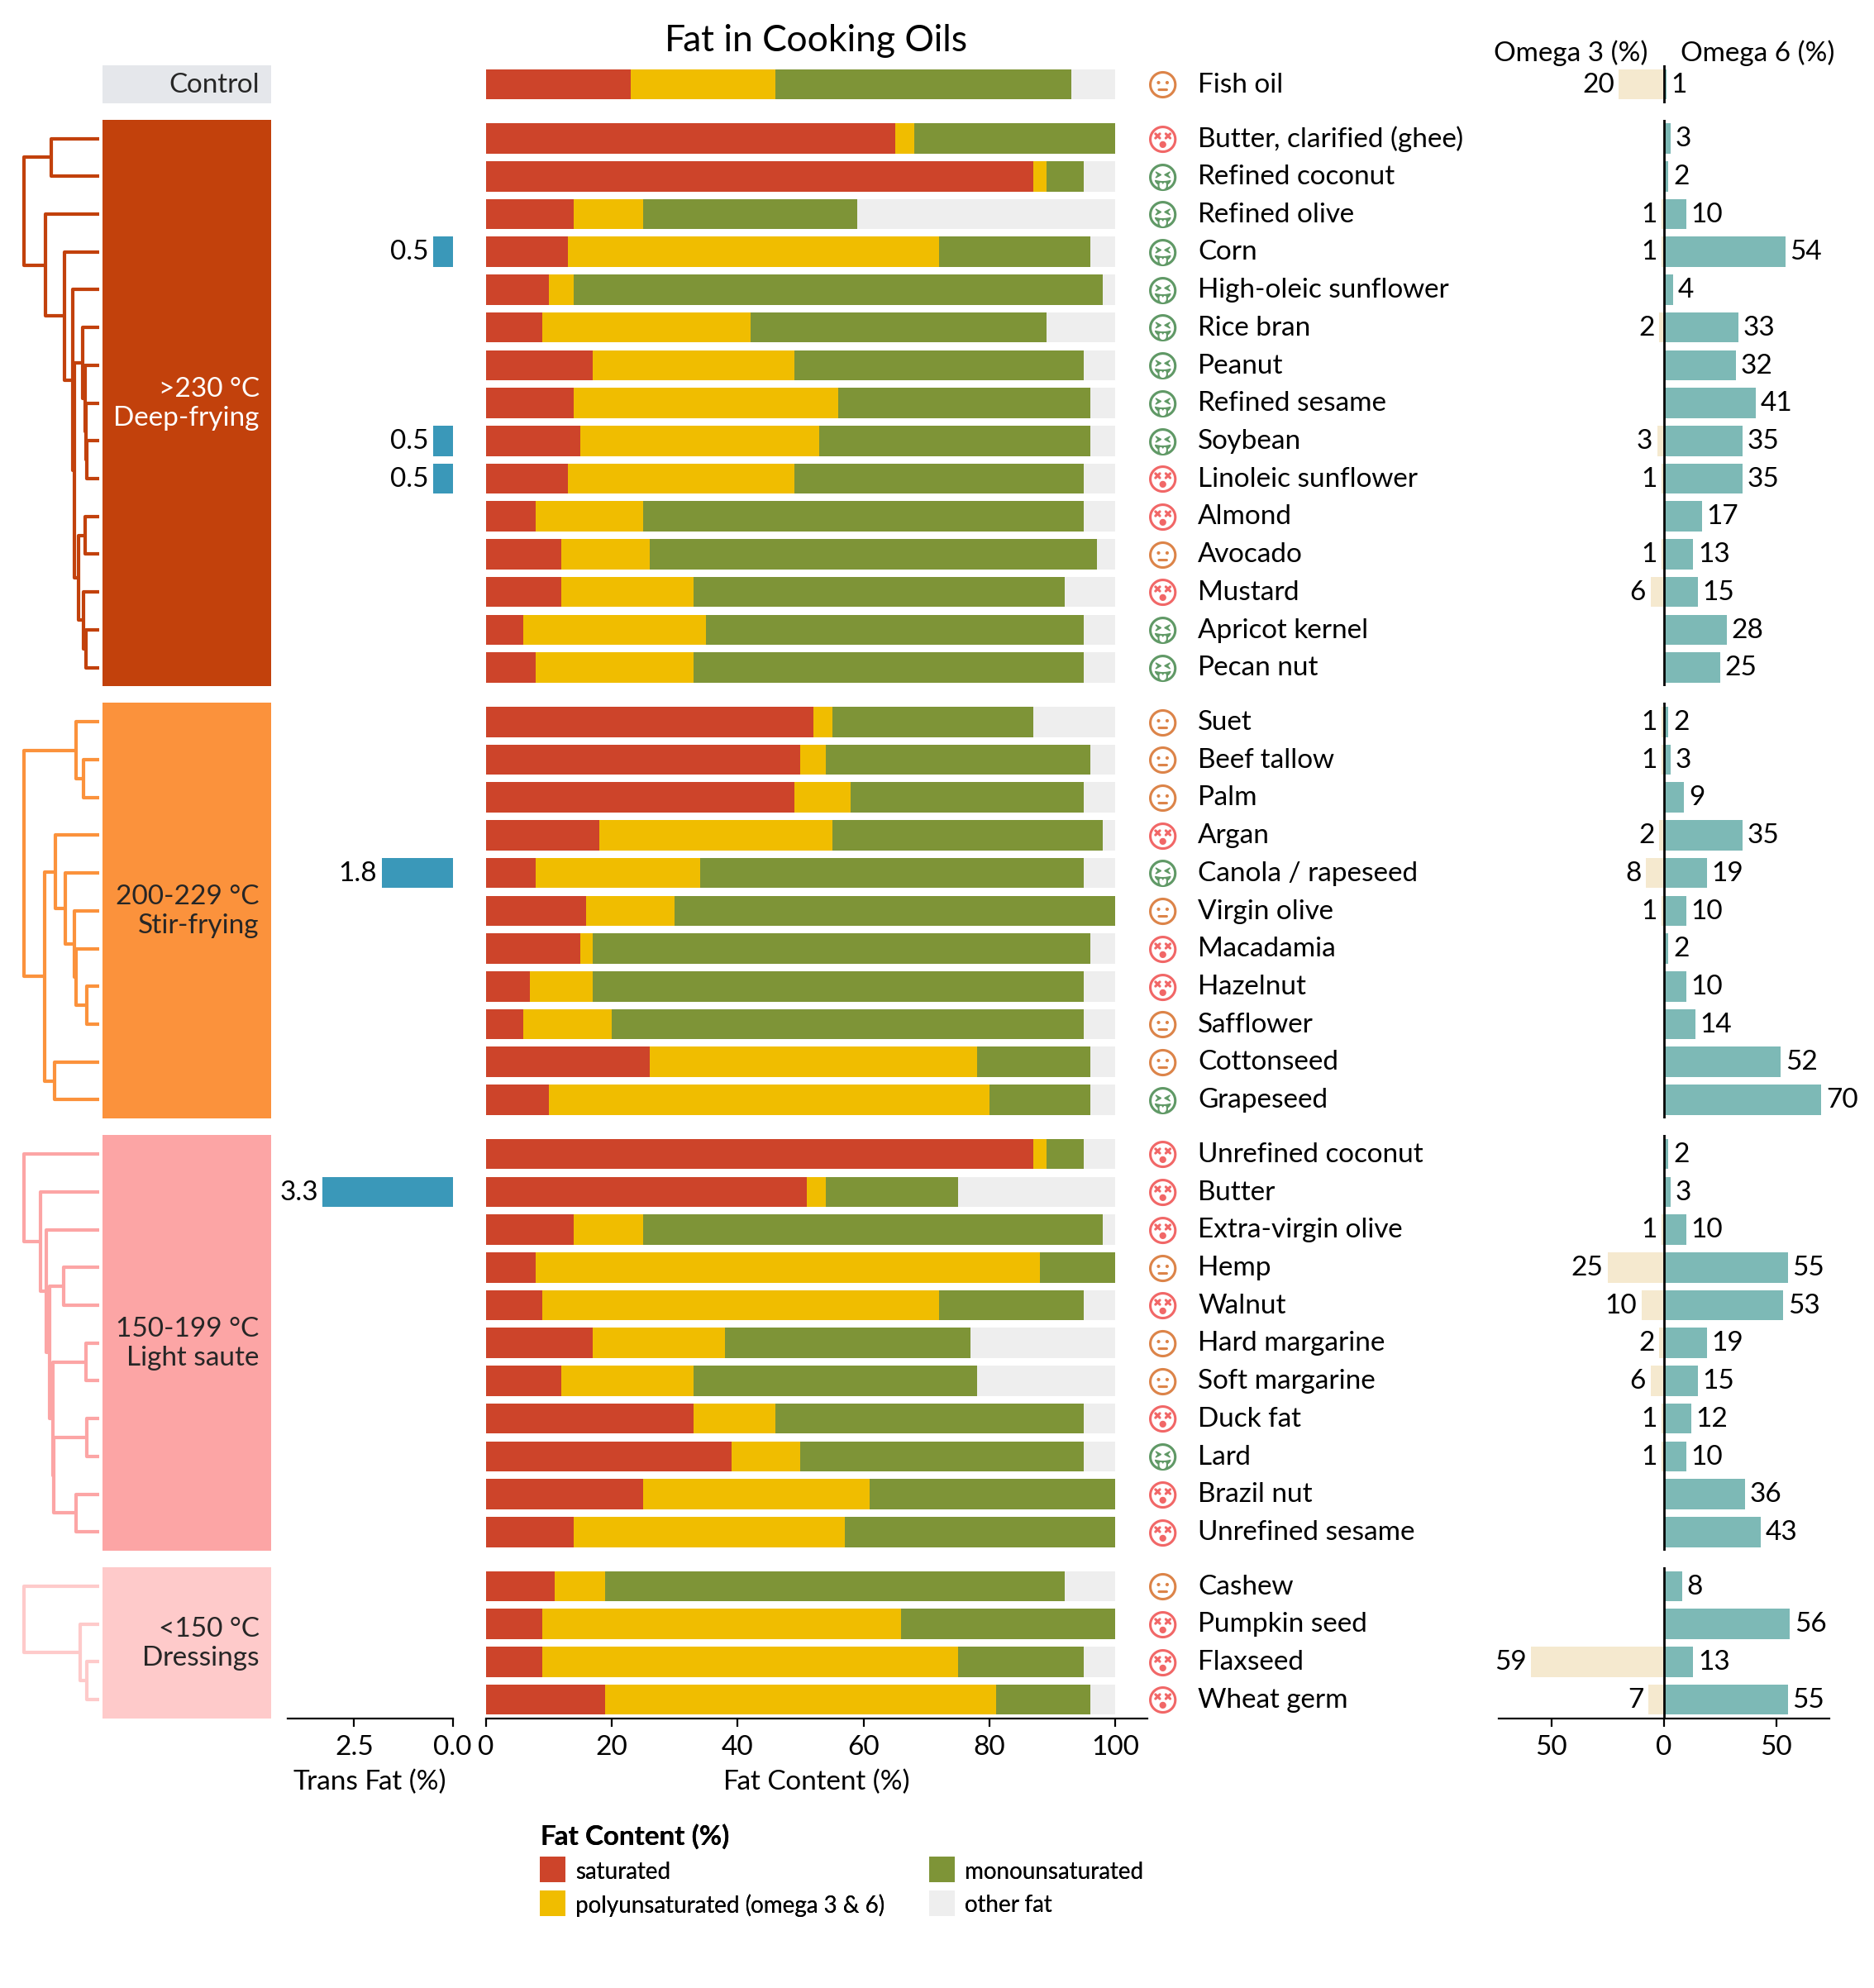
Fat content in cooking oils#
This example shows how to apply x-layout on statistical plots.
import marsilea as ma
import marsilea.plotter as mp

import mpl_fontkit as fk

fk.install_fontawesome(verbose=False)
fk.install("Lato", verbose=False)
Load data#
oils = ma.load_data('cooking_oils')

red = "#cd442a"
yellow = "#f0bd00"
green = "#7e9437"
gray = "#eee"

mapper = {0: "\uf58a", 1: "\uf11a", 2: "\uf567"}
cmapper = {0: '#609966', 1: '#DC8449', 2: '#F16767'}
flavour = [mapper[i] for i in oils['flavour'].values]
flavour_colors = [cmapper[i] for i in oils['flavour'].values]
fat_content = oils[['saturated', 'polyunsaturated (omega 3 & 6)',
                    'monounsaturated', 'other fat']]
Visualize the oil contents#
fat_stack_bar = mp.StackBar(fat_content.T * 100, colors=[red, yellow, green, gray],
                            width=.8, orient="h", label="Fat Content (%)",
                            legend_kws={'ncol': 2, 'fontsize': 10})
fmt = lambda x: f"{x:.1f}" if x > 0 else ""
trans_fat_bar = mp.Numbers(oils['trans fat'] * 100, fmt=fmt, color="#3A98B9", label="Trans Fat (%)", )

flavour_emoji = mp.Labels(flavour, fontfamily="Font Awesome 6 Free", text_props={'color': flavour_colors})

oil_names = mp.Labels(oils.index.str.capitalize())

fmt = lambda x: f"{int(x)}" if x > 0 else ""

omege_bar = ma.plotter.CenterBar((oils[['omega 3', 'omega 6']] * 100).astype(int), names=["Omega 3 (%)", "Omega 6 (%)"],
                                 colors=["#7DB9B6", "#F5E9CF"], fmt=fmt, show_value=True)
conditions_text = ["Control", ">230 °C\nDeep-frying", "200-229 °C\nStir-frying",
                   "150-199 °C\nLight saute", "<150 °C\nDressings"]
colors = ["#e5e7eb", "#c2410c", "#fb923c", "#fca5a5", "#fecaca"]
conditions = ma.plotter.Chunk(conditions_text, colors, rotation=0, padding=10)

cb = ma.ClusterBoard(fat_content.to_numpy(), height=10)
cb.add_layer(fat_stack_bar)
cb.add_left(trans_fat_bar, pad=.2, name="trans fat")
cb.add_right(flavour_emoji)
cb.add_right(oil_names, pad=.1)
cb.add_right(omege_bar, size=2, pad=.2)

order = ["Control", ">230 °C (Deep-frying)", "200-229 °C (Stir-frying)",
         "150-199 °C (Light saute)", "<150 °C (Dressings)"]
cb.hsplit(labels=oils['cooking conditions'], order=order)
cb.add_left(conditions, pad=.1)
cb.add_dendrogram("left", add_meta=False, colors=colors,
                  linewidth=1.5, size=.5, pad=.02)
cb.add_title(top="Fat in Cooking Oils", fontsize=16)
cb.add_legends("bottom", pad=.3)
cb.render()

axes = cb.get_ax("trans fat")
for ax in axes:
    ax.set_xlim(4.2, 0)
Total running time of the script: (0 minutes 5.571 seconds)