Skip to main content
Back to top
Ctrl
+
K
Tutorial
Gallery
API
Installation
How-To
GitHub
Tutorial
Gallery
API
Installation
How-To
GitHub
Section Navigation
Basics
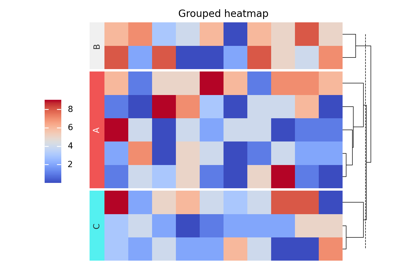
Grouped heatmap
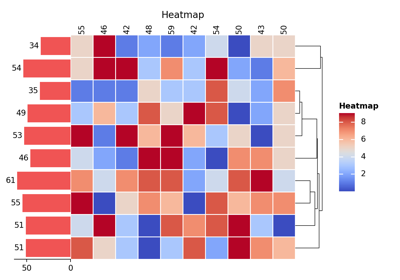
Heatmap
All Plotters
AnnoLabels
Arc
Bar
Box
Boxen
CenterBar
Chunk
ColorMesh
Colors
FixedChunk
Labels
MarkerMesh
Numbers
Point
SeqLogo
SizedMesh
StackBar
Strip
Swarm
TextMesh
Title
Violin
Real World Data Visualization
Les Miserables Arc Diagram
Current available plotters in Marsilea
Bivariate Distribution
Mouse Embryo Map
Fat content in cooking oils
Breast cancer mutation with Oncoprinter
Visualizing Single-cell RNA-seq Data
Visualizing Single-cell Multi-Omics Data
Sequence Alignment Plot
Annotate stacked bar
Upset Plot
Gallery
Basics
Basics
#
Grouped heatmap
Grouped heatmap
Heatmap
Heatmap