Note
Go to the end to download the full example code
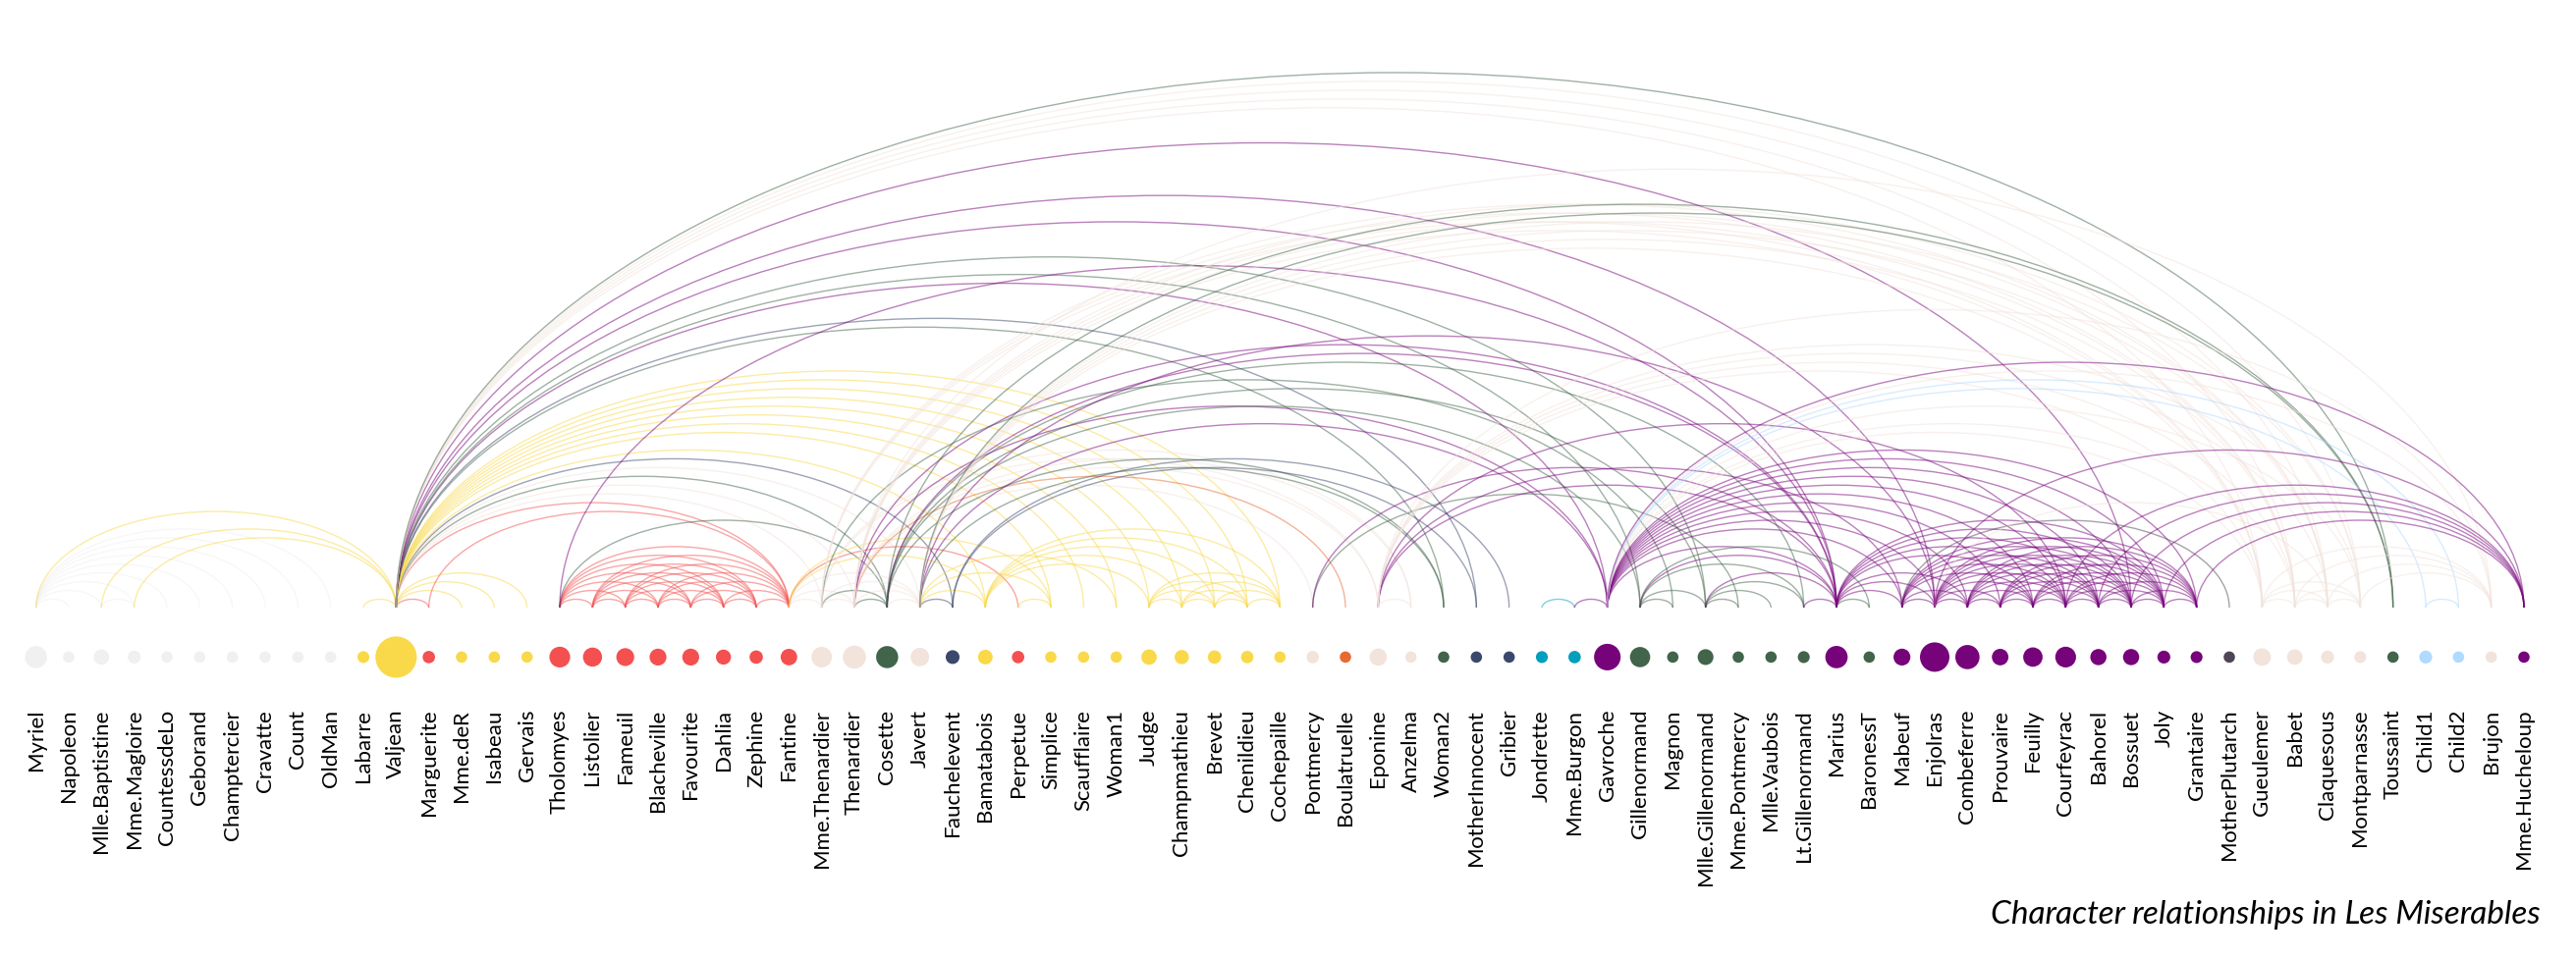
Les Miserables Arc Diagram#
This example shows how to create an arc diagram from a network.
import numpy as np
import marsilea as ma
import marsilea.plotter as mp
Load data#
data = ma.load_data('les_miserables')
nodes = data['nodes']
links = data['links']

sizes = nodes['value'].to_numpy().reshape(1, -1)
colors = nodes['group'].to_numpy().reshape(1, -1)
Create Arc Diagram#
palette = {
    0: "#3C486B",
    1: "#F0F0F0",
    2: "#F9D949",
    3: "#F45050",
    4: "#F2E3DB",
    5: "#41644A",
    6: "#E86A33",
    7: "#009FBD",
    8: "#77037B",
    9: "#4F4557",
    10: "#B0DAFF"
}

link_colors = [palette[nodes.iloc[i].group] for i in links['source']]

height = .5
width = height * len(nodes) / 3

sh = ma.SizedHeatmap(sizes, colors, palette=palette, sizes=(10, 200),
                     frameon=False, height=height, width=width)
sh.add_bottom(mp.Labels(nodes['name'], fontsize=8))
arc = mp.Arc(nodes.index, links.to_numpy(),
             colors=link_colors, lw=.5, alpha=.5)
sh.add_top(arc, size=3)
sh.add_title(bottom="Character relationships in Les Miserables",
             align="right", fontstyle="italic")
sh.render()
Total running time of the script: (0 minutes 4.466 seconds)