marsilea.plotter.Area#
- class Area(data, color=None, add_outline=True, alpha=0.4, linecolor=None, linewidth=1, group_kws=None, label=None, label_loc=None, label_props=None, **kwargs)#
Bases:
StatsBaseArea plot
- Parameters:
- dataarray-like
The data to be plotted.
- colorcolor-like
The color of the area
- add_outlinebool
Whether to add outline to the area
- alphafloat
The transparency of the area
- linecolorcolor-like
The color of the outline
- linewidthfloat
The width of the outline
- group_kwsdict
The configurations that apply to each group
- **kwargs
Additional configurations for the area plot, see
matplotlib.pyplot.fill_between()
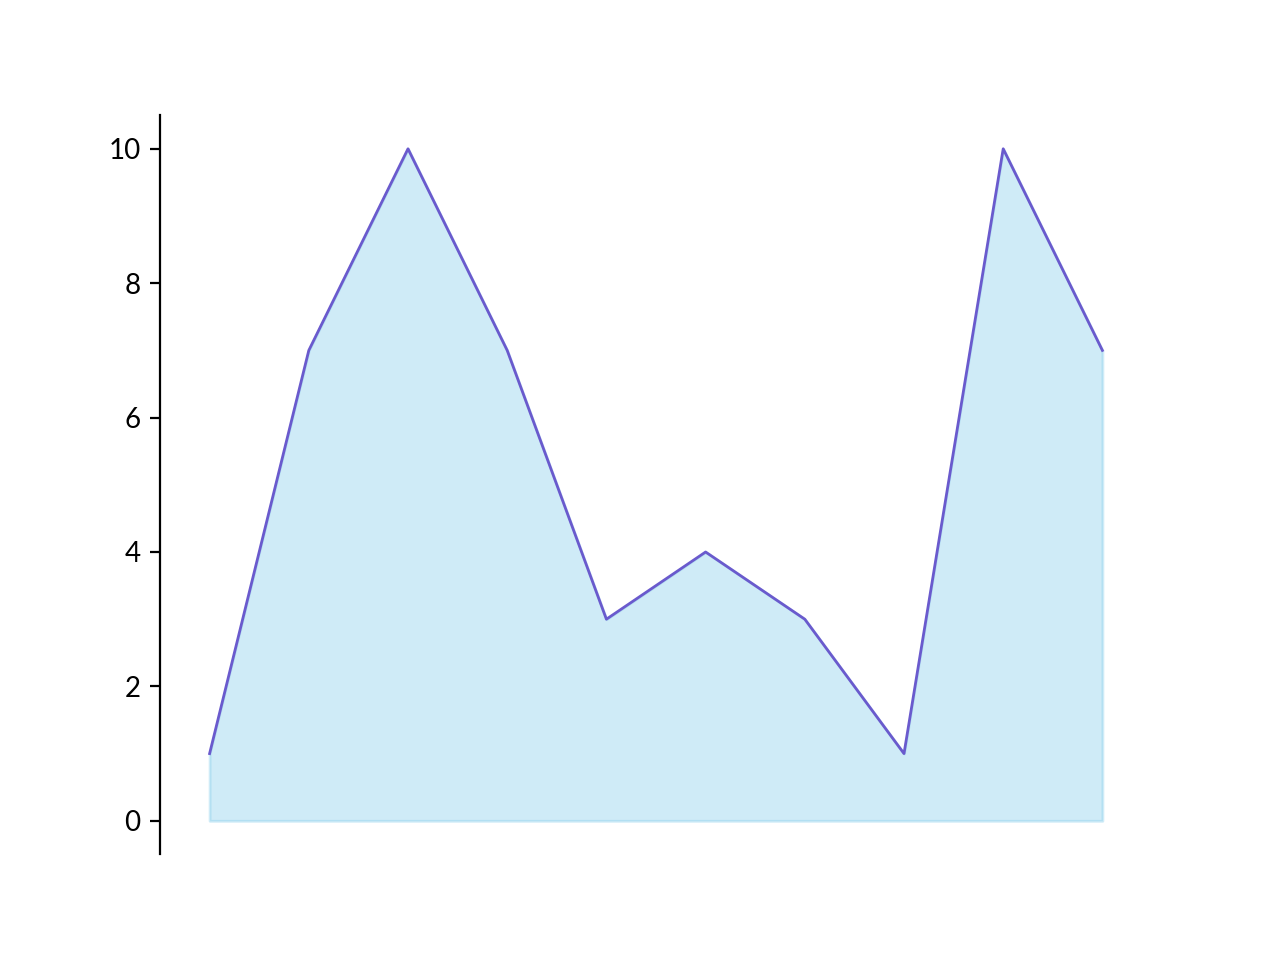
Examples
import numpy as np
import matplotlib.pyplot as plt

from marsilea.plotter import Area

_, ax = plt.subplots()
data = np.random.randint(0, 10, 10) + 1
Area(data).render(ax)