Note
Go to the end to download the full example code.
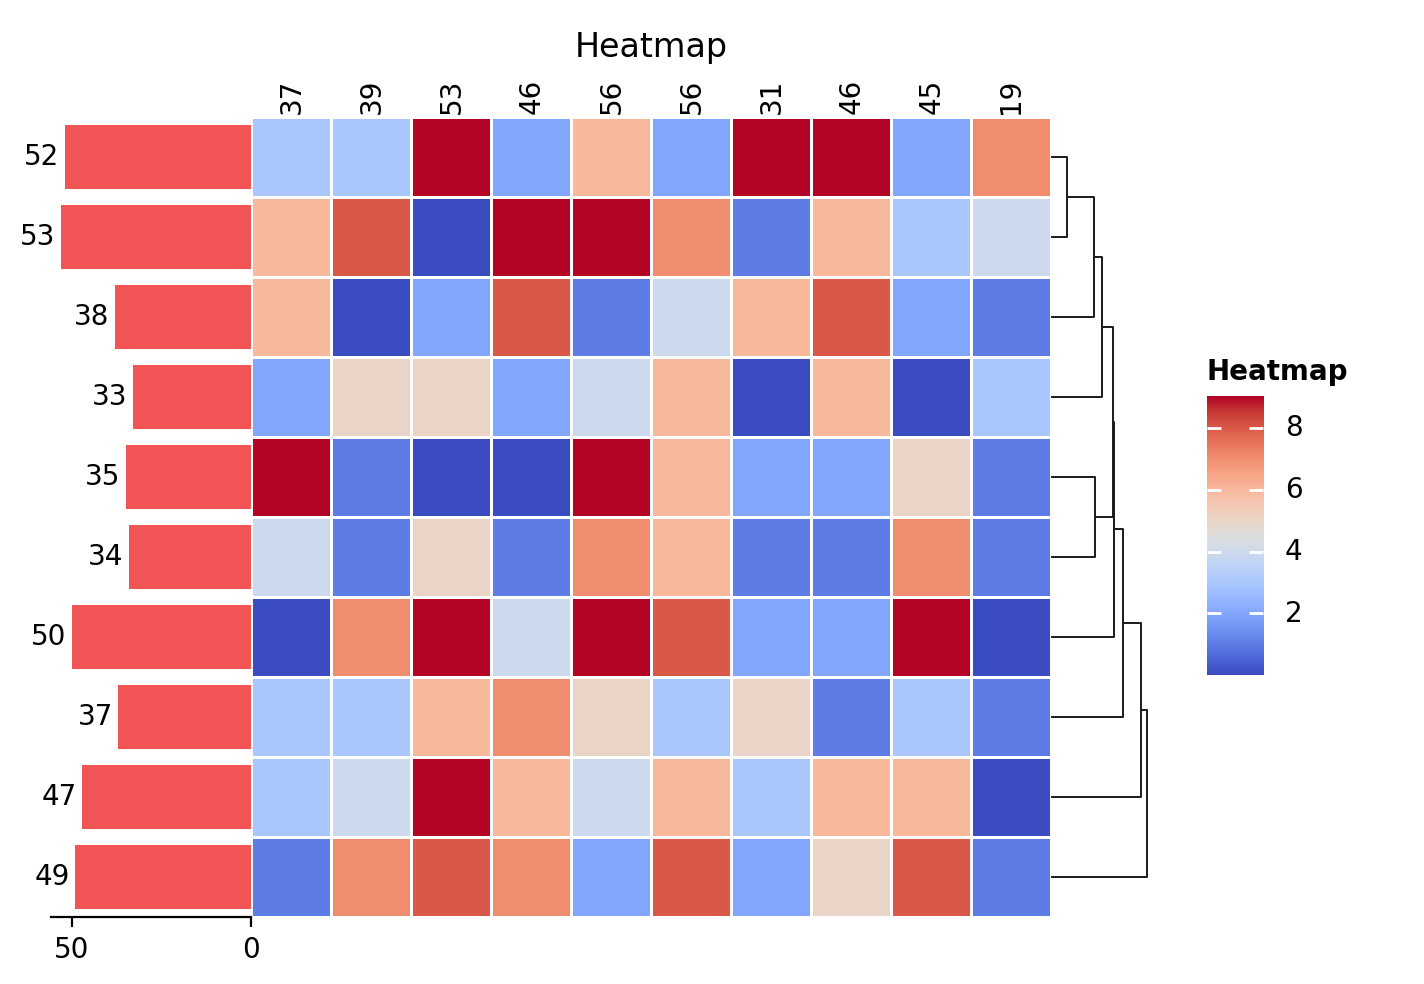
Heatmap#
import numpy as np
import marsilea as ma

data = np.random.randint(0, 10, (10, 10))
h = ma.Heatmap(data, linewidth=1, label="Heatmap")
h.add_dendrogram("right")
h.add_left(ma.plotter.Numbers(data.sum(axis=1), color="#F05454"))
h.add_top(ma.plotter.Labels(data.sum(axis=0)))
h.add_legends()
h.add_title("Heatmap")
h.render()
Total running time of the script: (0 minutes 0.771 seconds)