Note
Go to the end to download the full example code.
Current available plotters in Marsilea#
Import libraries
import numpy as np
import matplotlib.pyplot as plt
import pandas as pd

import marsilea as ma
import marsilea.plotter as mp

from marsilea.layers import Rect, RightTri, FrameRect, FracRect


def label_ax(ax, text):
    ax.text(
        1.05, 0.5, text, fontsize=16, transform=ax.transAxes, ha="left", va="center"
    )
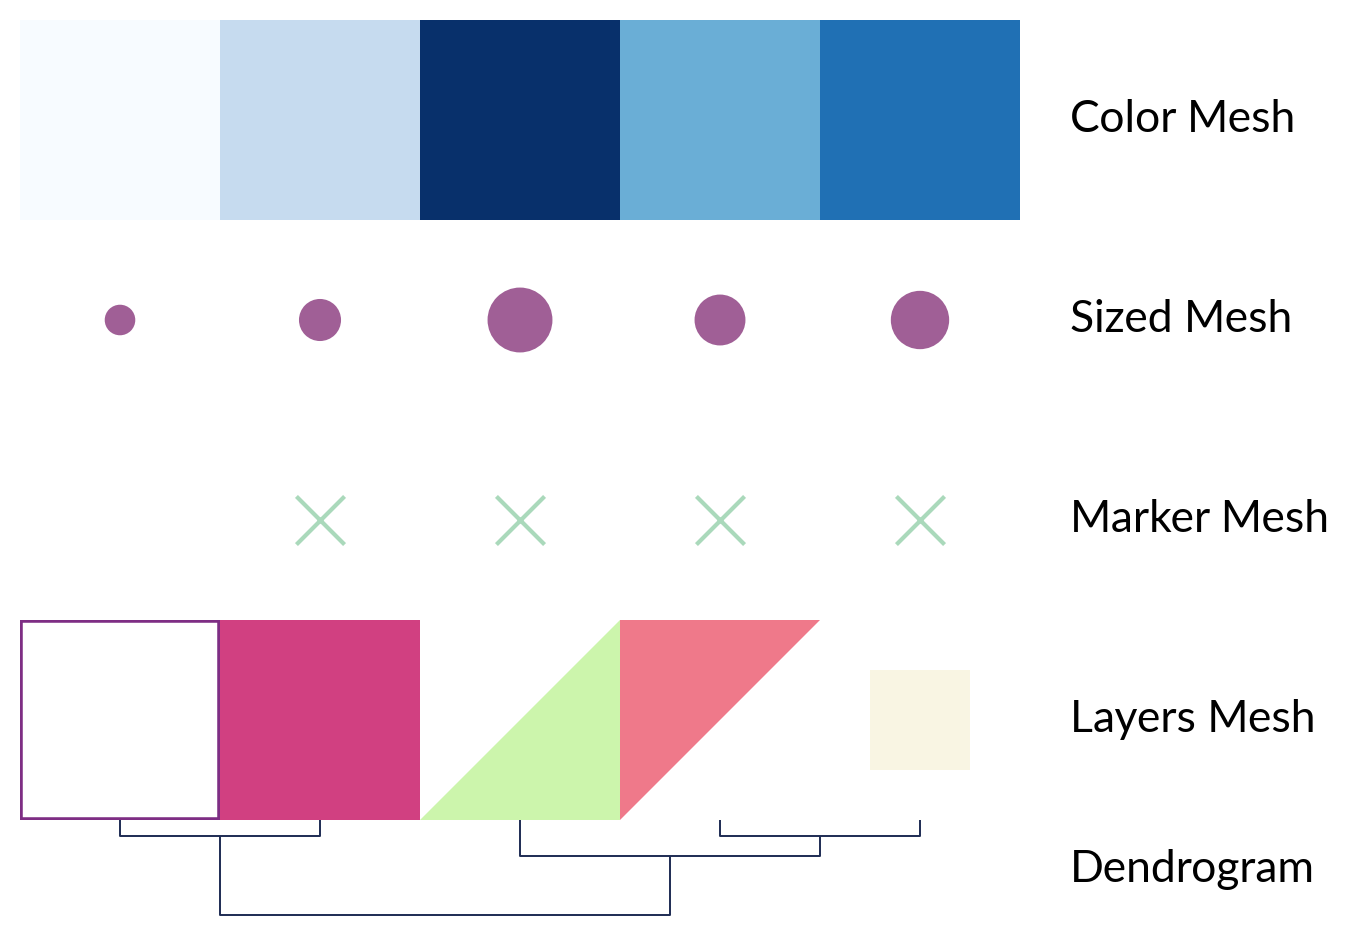
Mesh plotters
plt.ion()
rng = np.random.default_rng(0)
data = np.arange(5)
data2d = np.arange(5).reshape(1, 5)
pieces = {
    0: FrameRect(color="#7E2E84", width=2),
    1: Rect(color="#D14081"),
    2: RightTri(color="#EF798A"),
    3: FracRect(color="#F9F5E3", frac=(0.5, 0.5)),
    4: RightTri(color="#CCF5AC", right_angle="upper right"),
}

plotters = {
    "Color Mesh": mp.ColorMesh(data2d, cmap="Blues"),
    "Sized Mesh": mp.SizedMesh(data2d, sizes=(100, 500), color="#A05F96"),
    "Marker Mesh": mp.MarkerMesh(data2d > 0, size=300, marker="x", color="#AAD9BB"),
    "Layers Mesh": ma.layers.LayersMesh(data2d, pieces=pieces),
}

canvas = ma.ZeroHeightCluster(data2d, width=5)
for title, plotter in plotters.items():
    canvas.add_bottom(plotter, name=title)

canvas.add_dendrogram("bottom", method="ward", colors="#1D2B53", name="Dendrogram")
canvas.render()

for title in list(plotters.keys()) + ["Dendrogram"]:
    ax = canvas.get_ax(title)
    ax.set_axis_off()
    label_ax(ax, title)
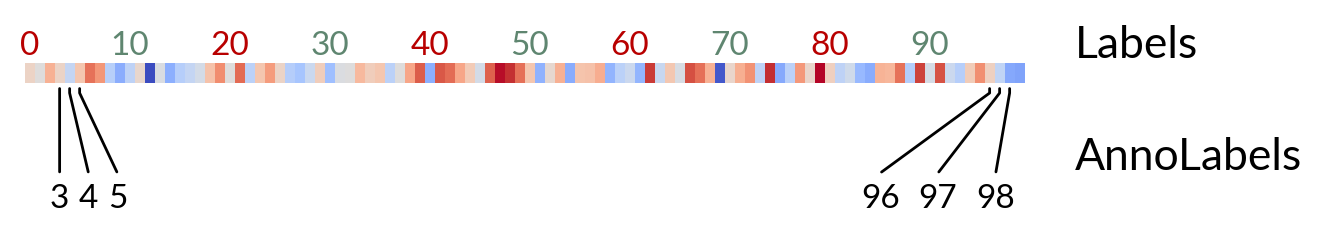
Label plotters
labels = np.arange(100)
text, text_color = [], []
for t in labels:
    if t % 10 == 0:
        text.append(t)
        if t / 10 % 2 == 0:
            text_color.append("#B80000")
        else:
            text_color.append("#5F8670")
    else:
        text.append("")
        text_color.append(".1")
matrix = rng.standard_normal((1, 100))
canvas2 = ma.Heatmap(matrix, width=5, height=0.1)
canvas2.add_top(
    mp.Labels(text, text_props={"color": text_color}, rotation=0), name="Labels"
)
canvas2.add_bottom(
    mp.AnnoLabels(labels, mark=[3, 4, 5, 96, 97, 98], rotation=0), name="AnnoLabels"
)
canvas2.render()

for title in ["Labels", "AnnoLabels"]:
    ax = canvas2.get_ax(title)
    label_ax(ax, title)
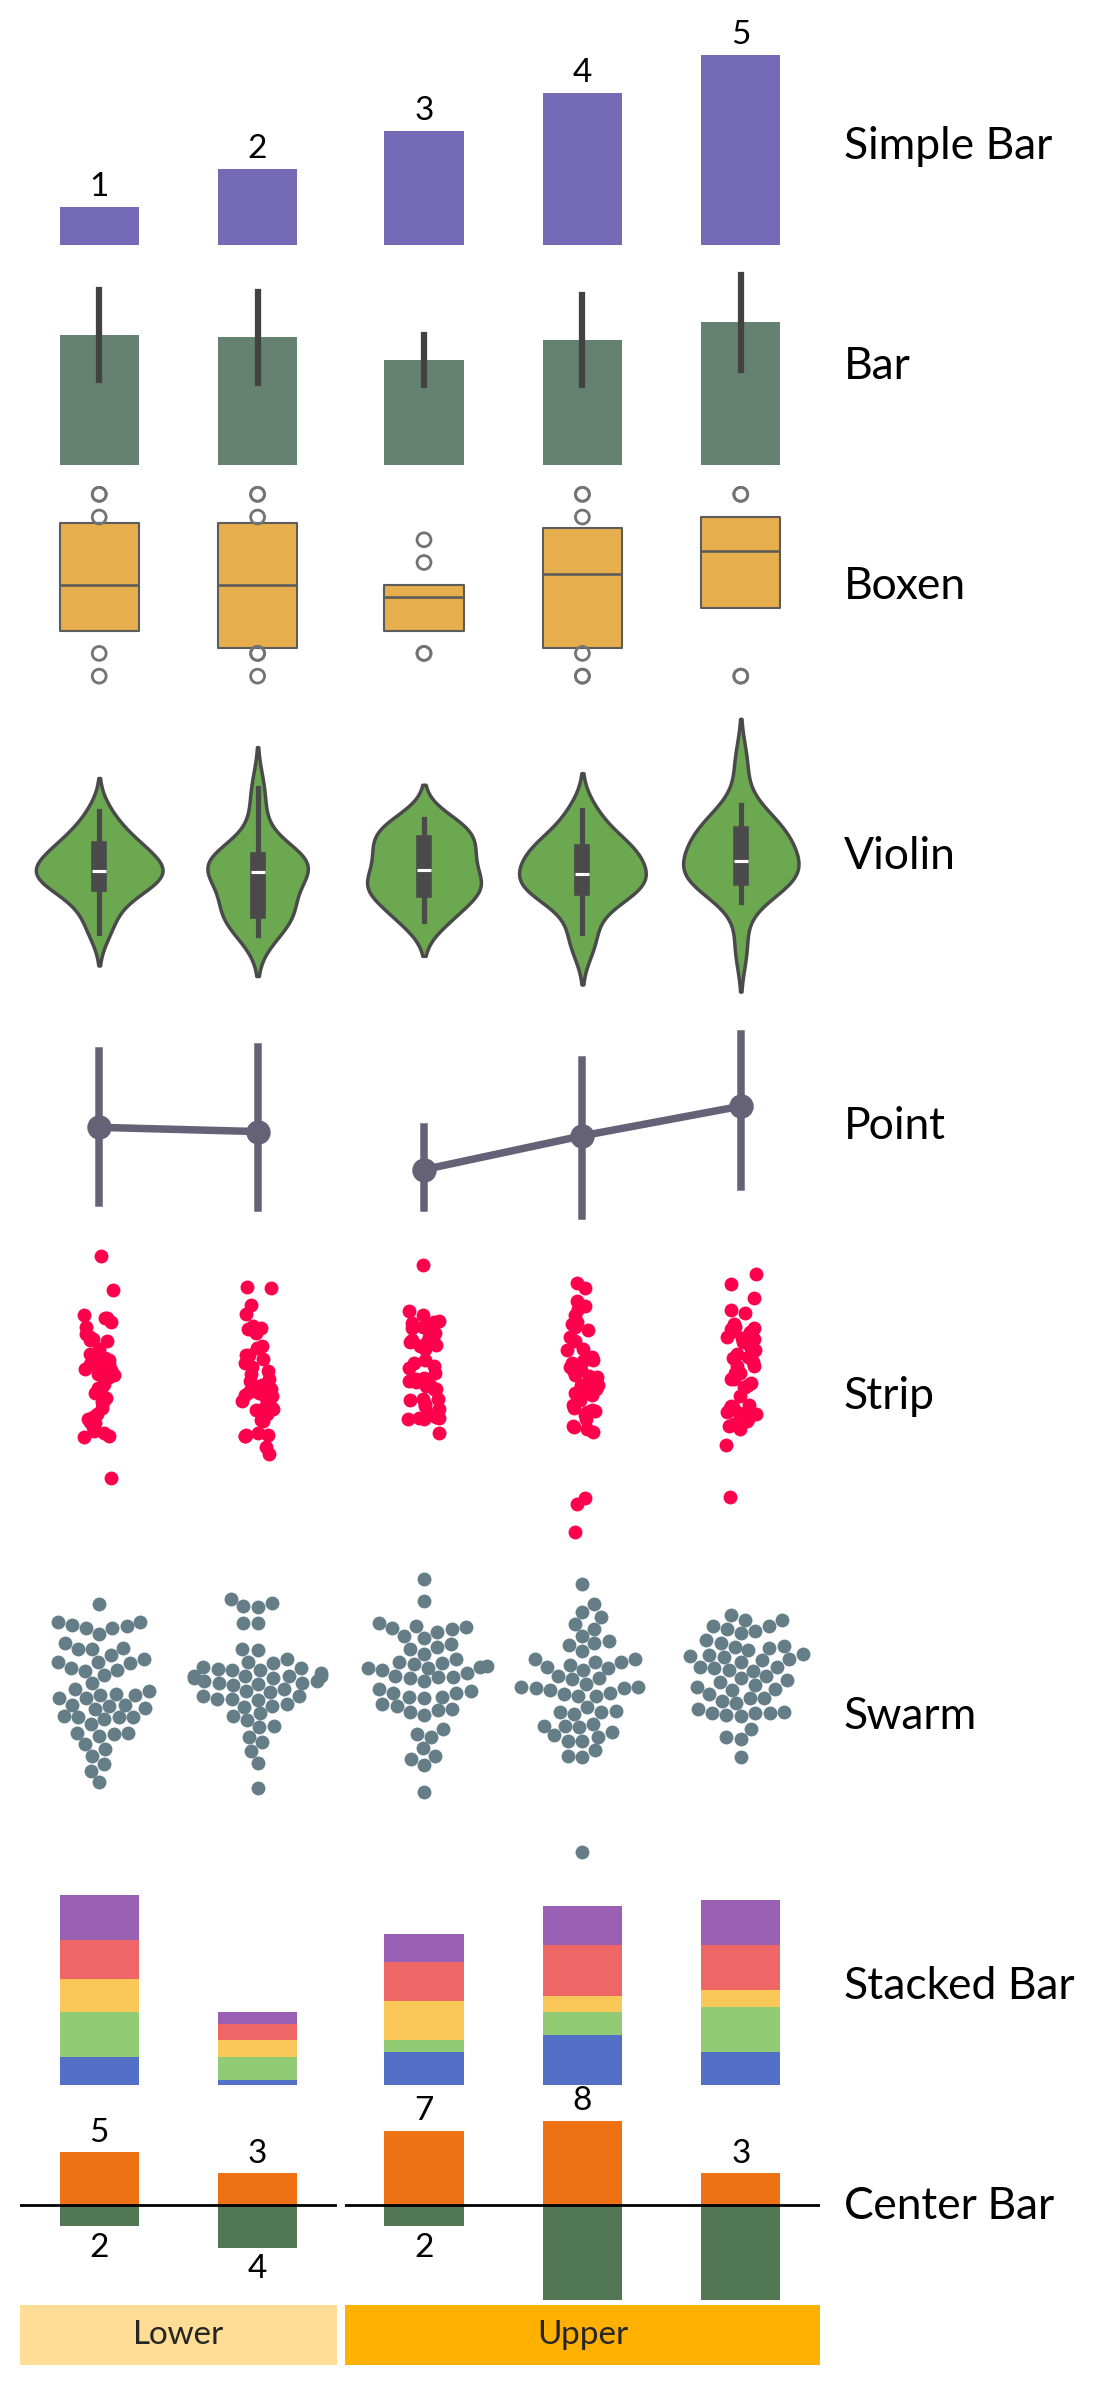
Statistics plotters
data1d = np.arange(1, 6)
data2d = rng.integers(1, 10, size=(10, 5))
bar_width = 0.5

plotters = {
    "Simple Bar": mp.Numbers(data1d, color="#756AB6", width=bar_width),
    "Bar": mp.Bar(data2d, color="#5F8670", width=bar_width),
    "Boxen": mp.Boxen(data2d, color="#FFB534", width=bar_width),
    "Violin": mp.Violin(rng.standard_normal((20, 5)), color="#65B741"),
    "Point": mp.Point(data2d, color="#656176"),
    "Strip": mp.Strip(rng.standard_normal((50, 5)), color="#FF004D"),
    "Swarm": mp.Swarm(rng.standard_normal((50, 5)), color="#647D87"),
    "Stacked Bar": mp.StackBar(
        rng.integers(1, 10, (5, 5)), items="abcde", width=bar_width
    ),
    "Center Bar": mp.CenterBar(
        rng.integers(1, 10, (5, 2)), colors=["#EE7214", "#527853"], width=bar_width
    ),
}

canvas3 = ma.Heatmap(rng.standard_normal((10, 5)), width=4, height=0)
for title, plotter in plotters.items():
    size = 1
    if title in ["Violin", "Strip", "Swarm"]:
        size = 1.5
    canvas3.add_bottom(plotter, pad=0.1, size=size, name=title)

canvas3.cut_cols(cut=[2])
canvas3.add_bottom(mp.Chunk(["Lower", "Upper"], ["#FFDD95", "#FFB000"], padding=10))

canvas3.render()
for ax in canvas3.figure.get_axes():
    # close axes spines
    for dir in ["left", "right", "top", "bottom"]:
        ax.spines[dir].set_visible(False)
    ax.tick_params(left=False, labelleft=False)

for title in plotters.keys():
    ax = canvas3.get_ax(title)[-1]
    label_ax(ax, title)
Other plotters
matrix = pd.DataFrame(data=rng.integers(1, 10, (4, 5)), index=list("ACGT"))
colors = {"A": "#D81159", "C": "#218380", "G": "#FBB13C", "T": "#73D2DE"}
weights = rng.integers(1, 10, 4)
seqlogo = mp.SeqLogo(matrix, color_encode=colors)
arc = mp.Arc(
    [1, 2, 3, 4, 5],
    [(1, 5), (2, 3), (1, 2), (4, 5)],
    weights=weights,
    width=(2, 5),
    colors="#534D56",
)

canvas4 = ma.ZeroHeightCluster(rng.standard_normal((10, 5)), width=4)
canvas4.add_top(seqlogo, size=2, name="Sequence Logo")
canvas4.add_top(arc, size=1, pad=0.2, name="Arc Diagram")
canvas4.render()

for title in ["Sequence Logo", "Arc Diagram"]:
    ax = canvas4.get_ax(title)
    label_ax(ax, title)

Total running time of the script: (0 minutes 9.213 seconds)