Note
Go to the end to download the full example code.
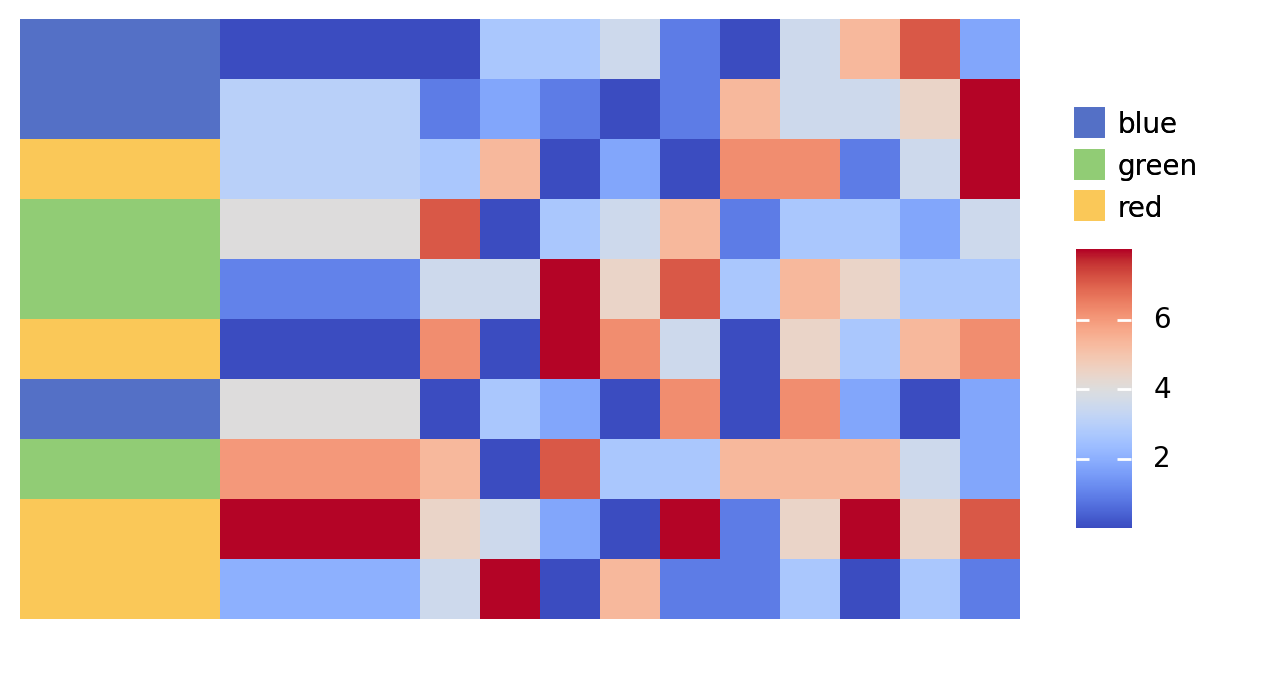
Ordering Legends#
This example demonstrates how to order legends in a plot.
h = ma.Heatmap(data, width=3, height=3)
h.add_left(ColorMesh(data[0]), name="Plot 1")
h.add_left(Colors(np.random.choice(["red", "blue", "green"], 10)), name="Plot 2")
h.add_legends(order=["Plot 2", "Plot 1"])
h.render()
Total running time of the script: (0 minutes 0.708 seconds)