Ctrl+K
marsilea 0.3.4 documentation - Home
  • Tutorial
  • Gallery
  • API
  • Installation
  • How-To
  • GitHub
  • Tutorial
  • Gallery
  • API
  • Installation
  • How-To
  • GitHub

Section Navigation

  • Layout
    • Figure Size and spacing
    • Label plotter
    • Add canvas margin
  • Clustering/Dendrogram
    • Colorful dendrogram
    • Meta dendrogram
  • Legends
    • Disabling the legend of a plot
    • Ordering Legends
  • Matplotlib-level customization
    • Add/Remove border
    • Retrieve axes
  • Save to file
    • Save to file
  • How-To?
  • Layout

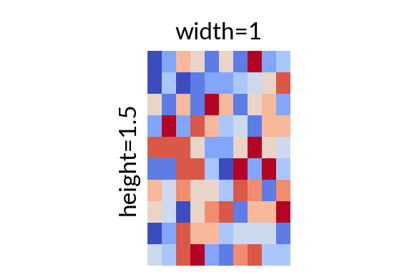
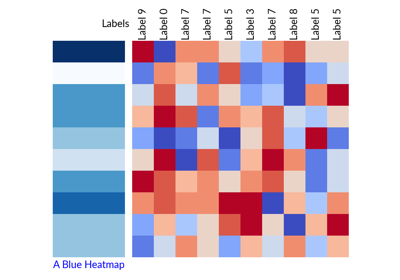
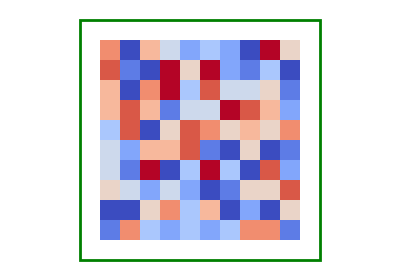
Layout#

Figure Size and spacing

Figure Size and spacing

Label plotter

Label plotter

Add canvas margin

Add canvas margin

previous

How-To?

next

Figure Size and spacing

© Copyright 2023, Mr-Milk.

Created using Sphinx 7.2.6.

Built with the PyData Sphinx Theme 0.15.2.