Note
Go to the end to download the full example code
Colorful dendrogram#
This example shows how to color a dendrogram based on the cluster labels.
# sphinx_gallery_thumbnail_number = 2
import numpy as np
import marsilea as ma

data = np.random.randint(0, 10, (10, 3))
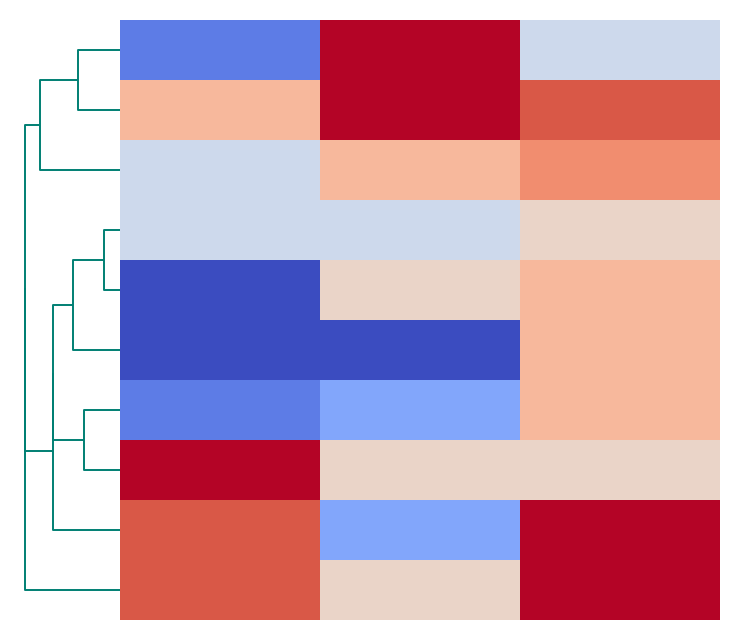
If you have one dendrogram, you can color it using the colors parameter.
h = ma.Heatmap(data, width=3, height=3)
h.add_dendrogram("left", colors="#007F73")
h.render()
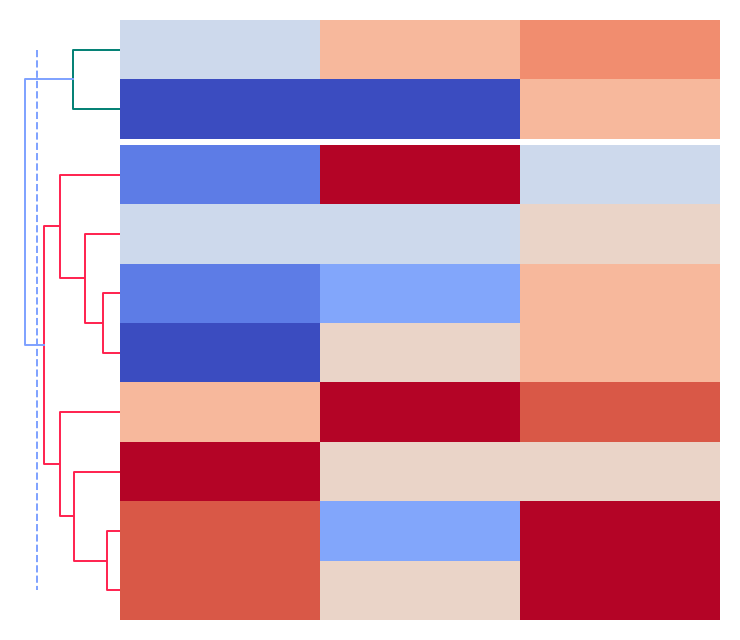
If you have more than one dendrogram, supply a list of color to colors parameter. To color the meta dendrogram, use the meta_colors parameter.
h = ma.Heatmap(data, width=3, height=3)
h.cut_rows([2])
h.add_dendrogram("left", colors=["#007F73", "#FF204E"], meta_color="#7EA1FF")
h.render()
Total running time of the script: (0 minutes 0.431 seconds)