Note
Go to the end to download the full example code
Breast cancer mutation with Oncoprinter#
The Dataset is collected from cBioportal: Breast Invasive Carcinoma (TCGA, PanCancer Atlas)
# sphinx_gallery_thumbnail_number = -1
import matplotlib.pyplot as plt

import marsilea as ma
import marsilea.plotter as mp
from oncoprinter import OncoPrint
Load data
onco_data = ma.load_data('oncoprint')
cna = onco_data['cna']
mrna_exp = onco_data['mrna_exp']
methyl_exp = onco_data['methyl_exp']
clinical = onco_data['clinical']
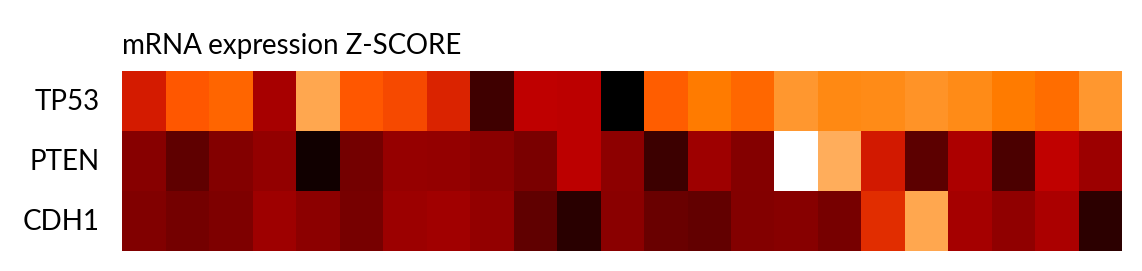
Make mRNA expression#
h = ma.Heatmap(mrna_exp, cmap="gist_heat_r", height=.9, width=5,
               cbar_kws=dict(orientation="horizontal",
                             title="mRNA Expression"))
h.add_title(top="mRNA expression Z-SCORE", align="left", fontsize=10)
h.add_left(mp.Labels(mrna_exp.index), pad=.1)
h.render()
Make Methylation expression#
m = ma.Heatmap(methyl_exp.astype(float), height=.6, width=5, cmap="summer_r",
               cbar_kws=dict(orientation="horizontal",
                             title="Methylation"))
m.add_title(top="Methylation", align="left", fontsize=10)
m.add_left(mp.Labels(methyl_exp.index), pad=.1)
m.render()

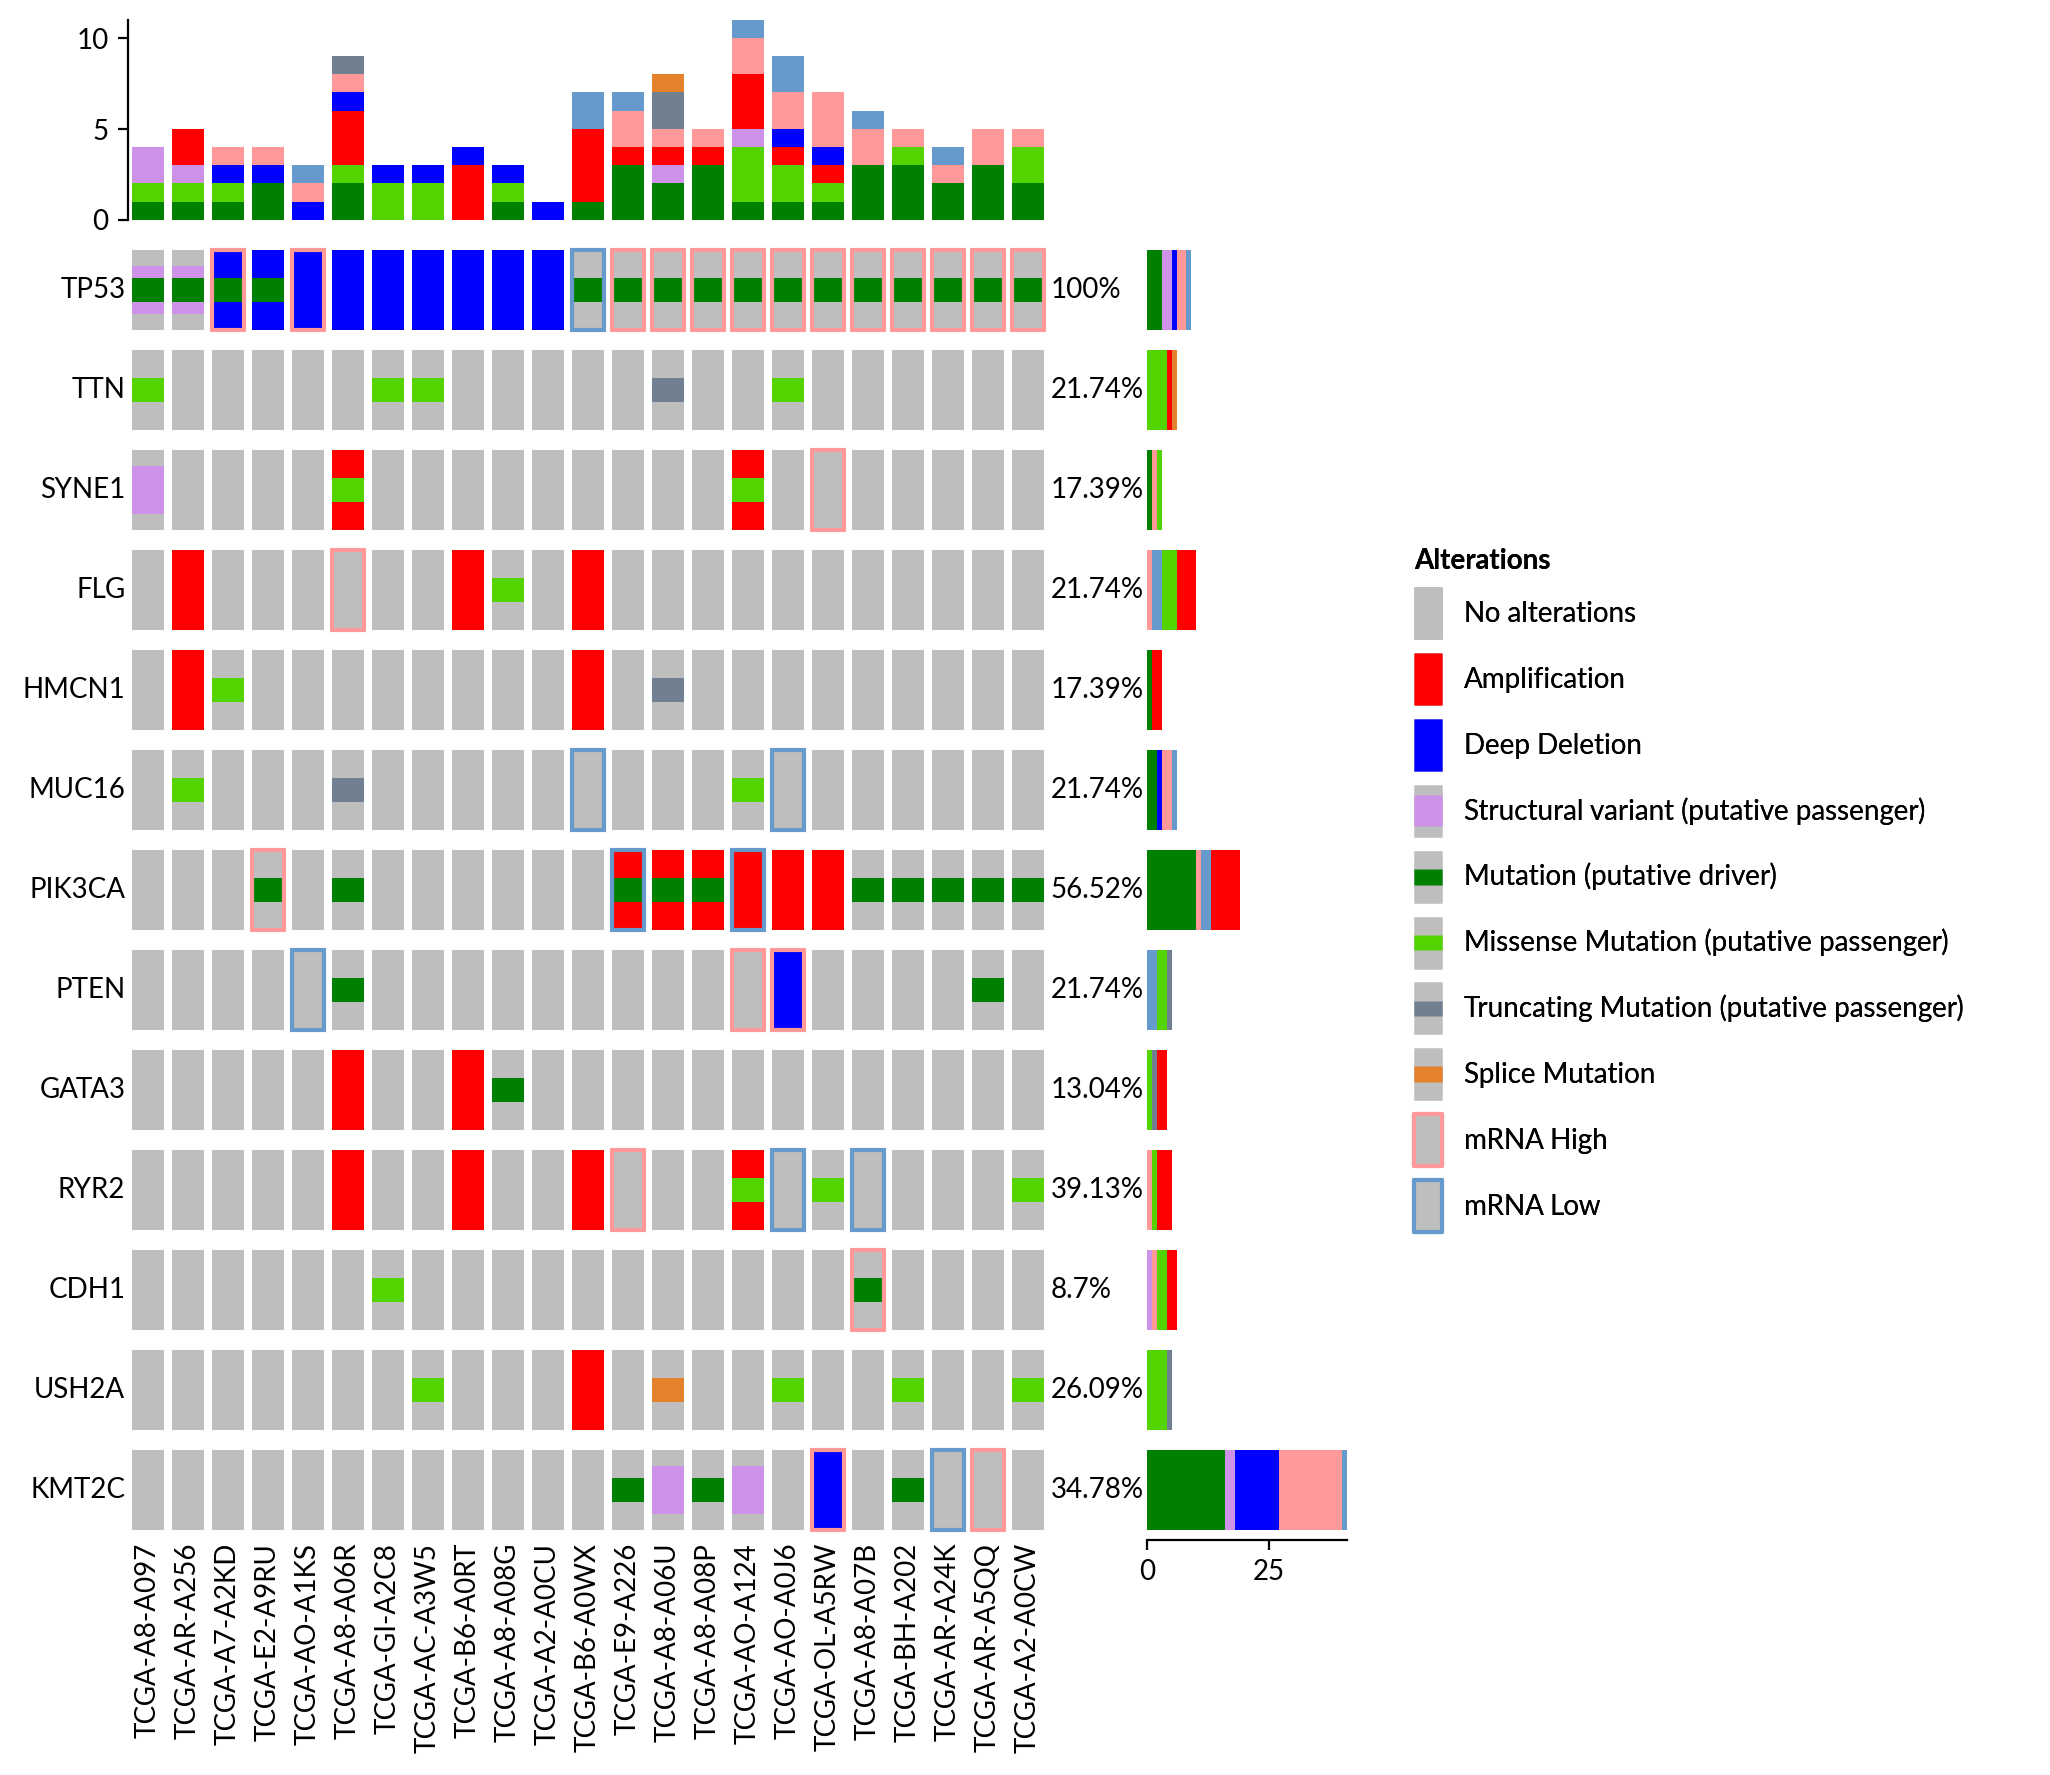
Create Oncoprint#
op = OncoPrint(cna, name="main")
op.render()
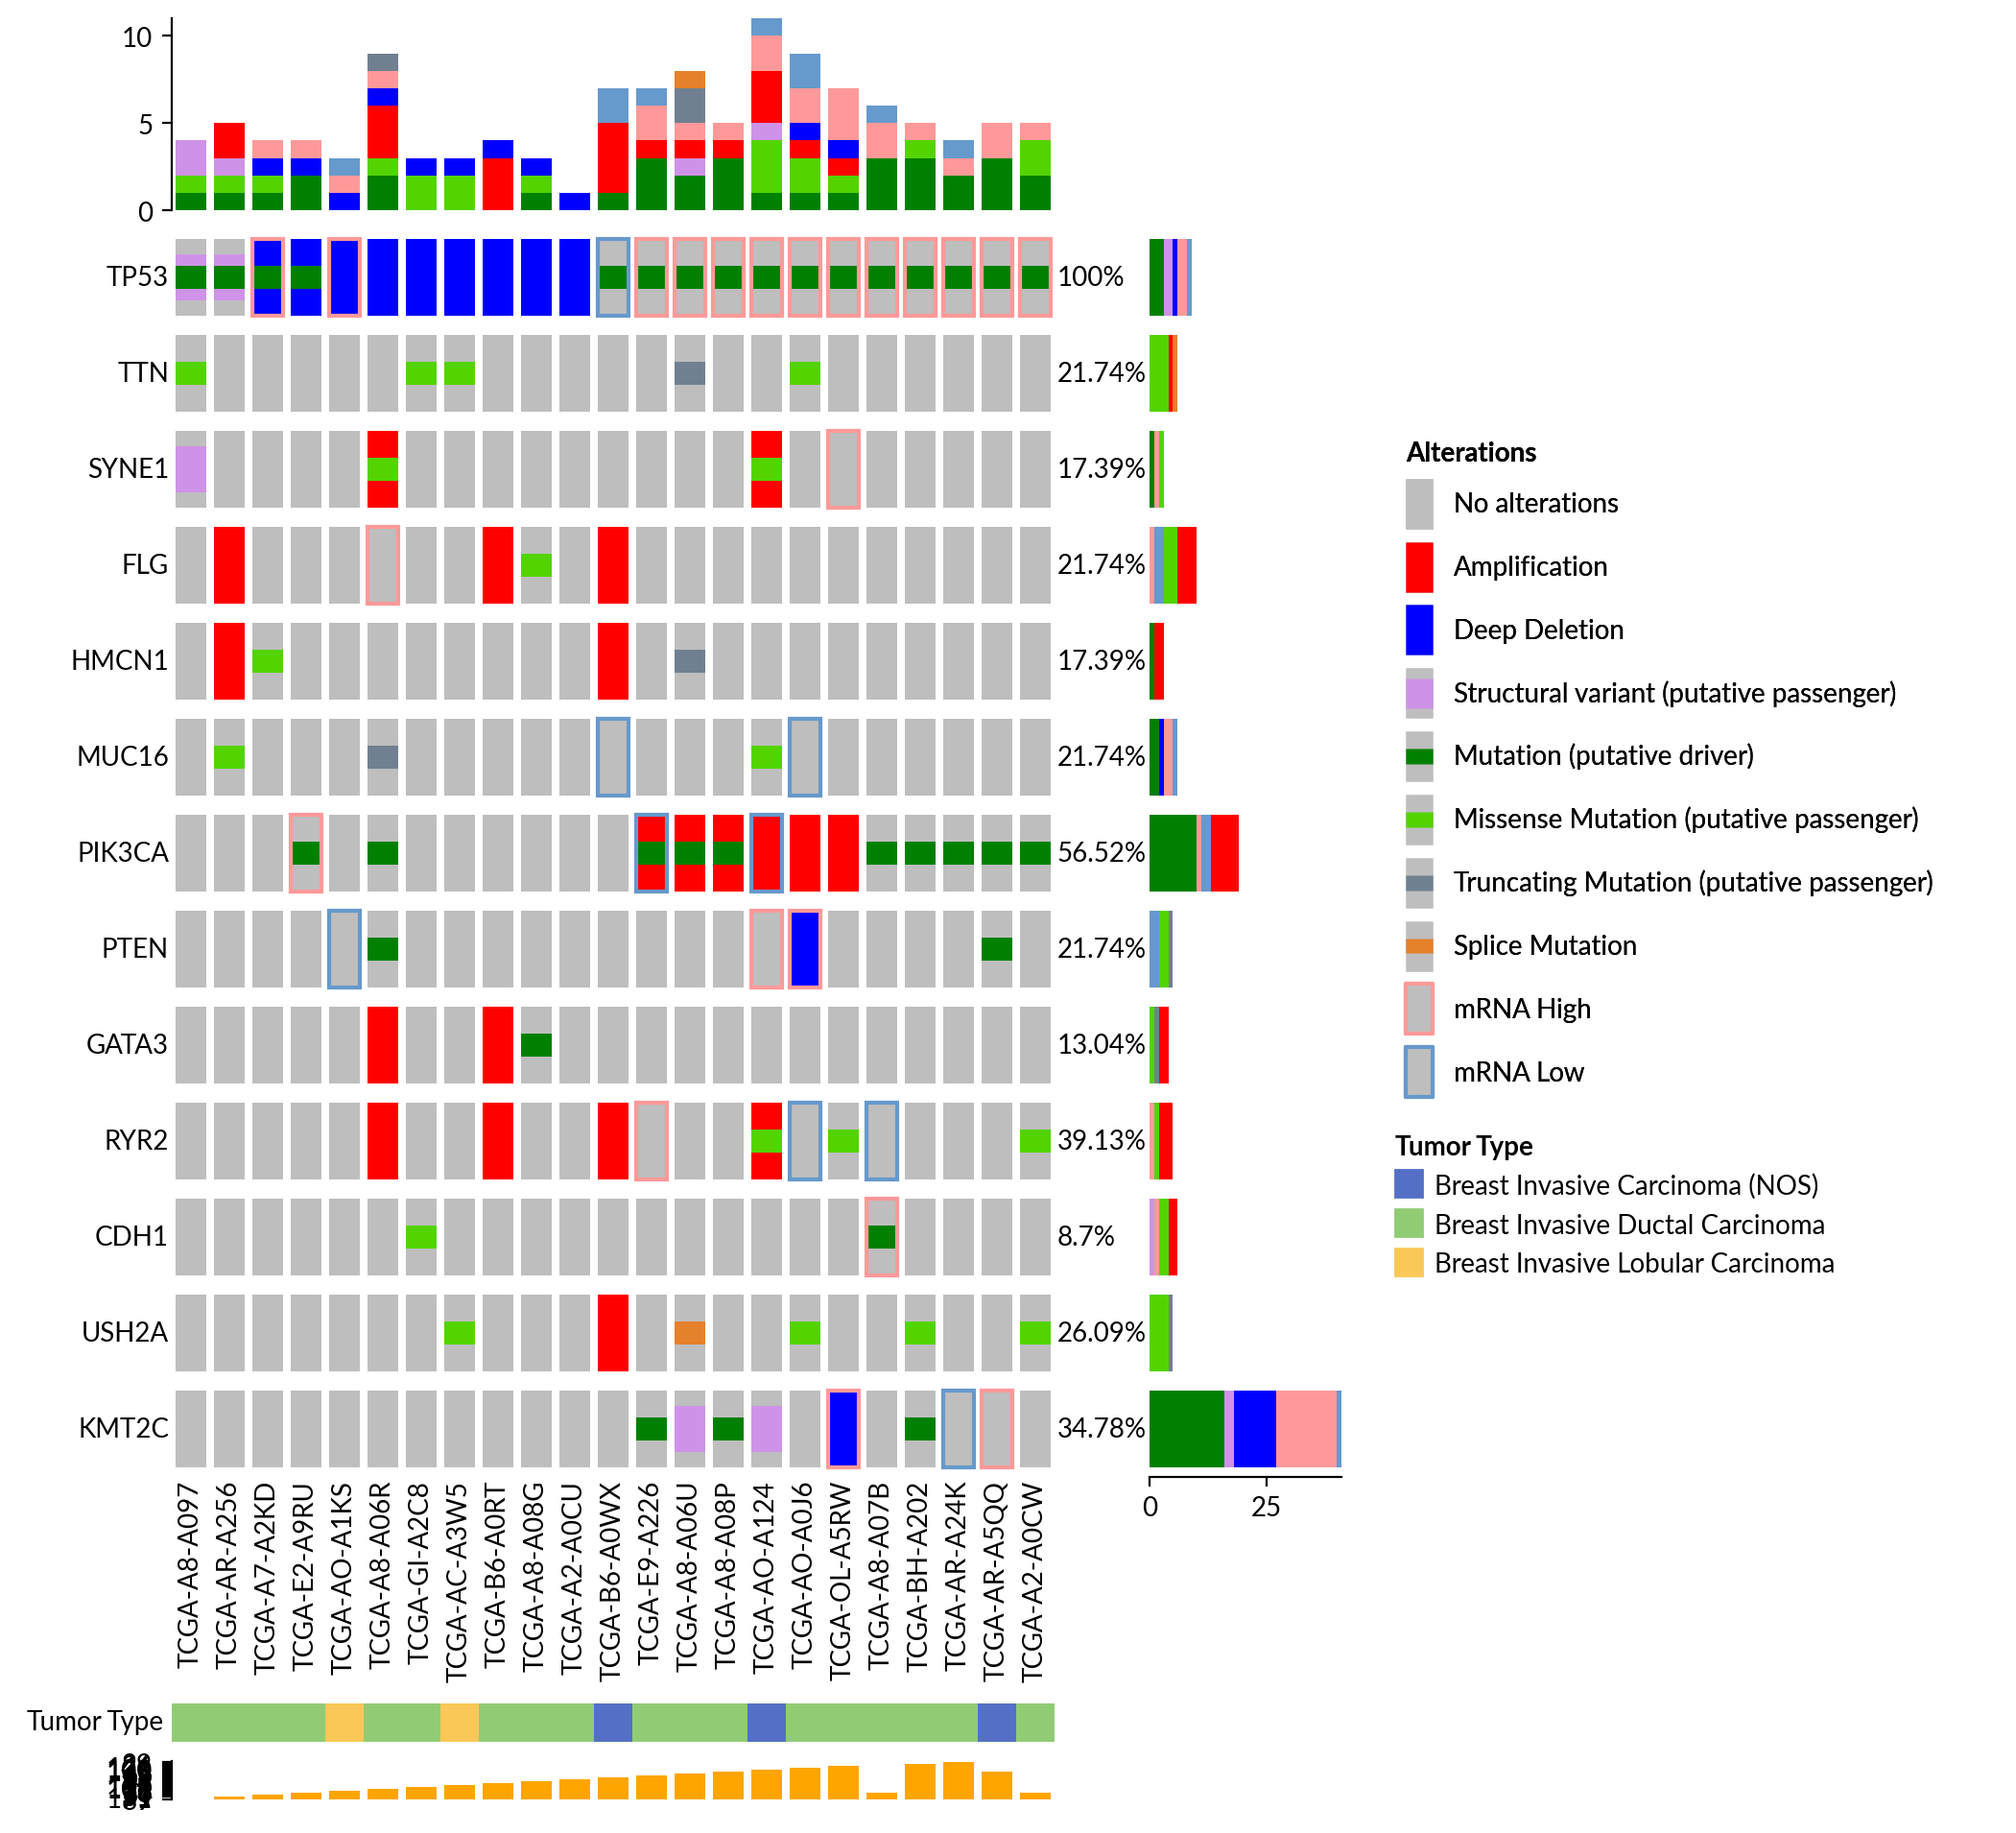
Make clinical information#
clinical = clinical[op.samples_order]
tumor_type = clinical.loc['Cancer Type Detailed']
tumor_colors = mp.Colors(tumor_type, label="Tumor Type", label_loc="left")

mut_count = clinical.loc['Mutation Count']
mut_number = mp.Numbers(mut_count, show_value=False, color="orange")
Add clinical to the oncoprint
op.add_bottom(tumor_colors, size=.2, pad=.1)
op.add_bottom(mut_number, size=.2, name="mutation_count", pad=.1,
              legend=False)
op.render()
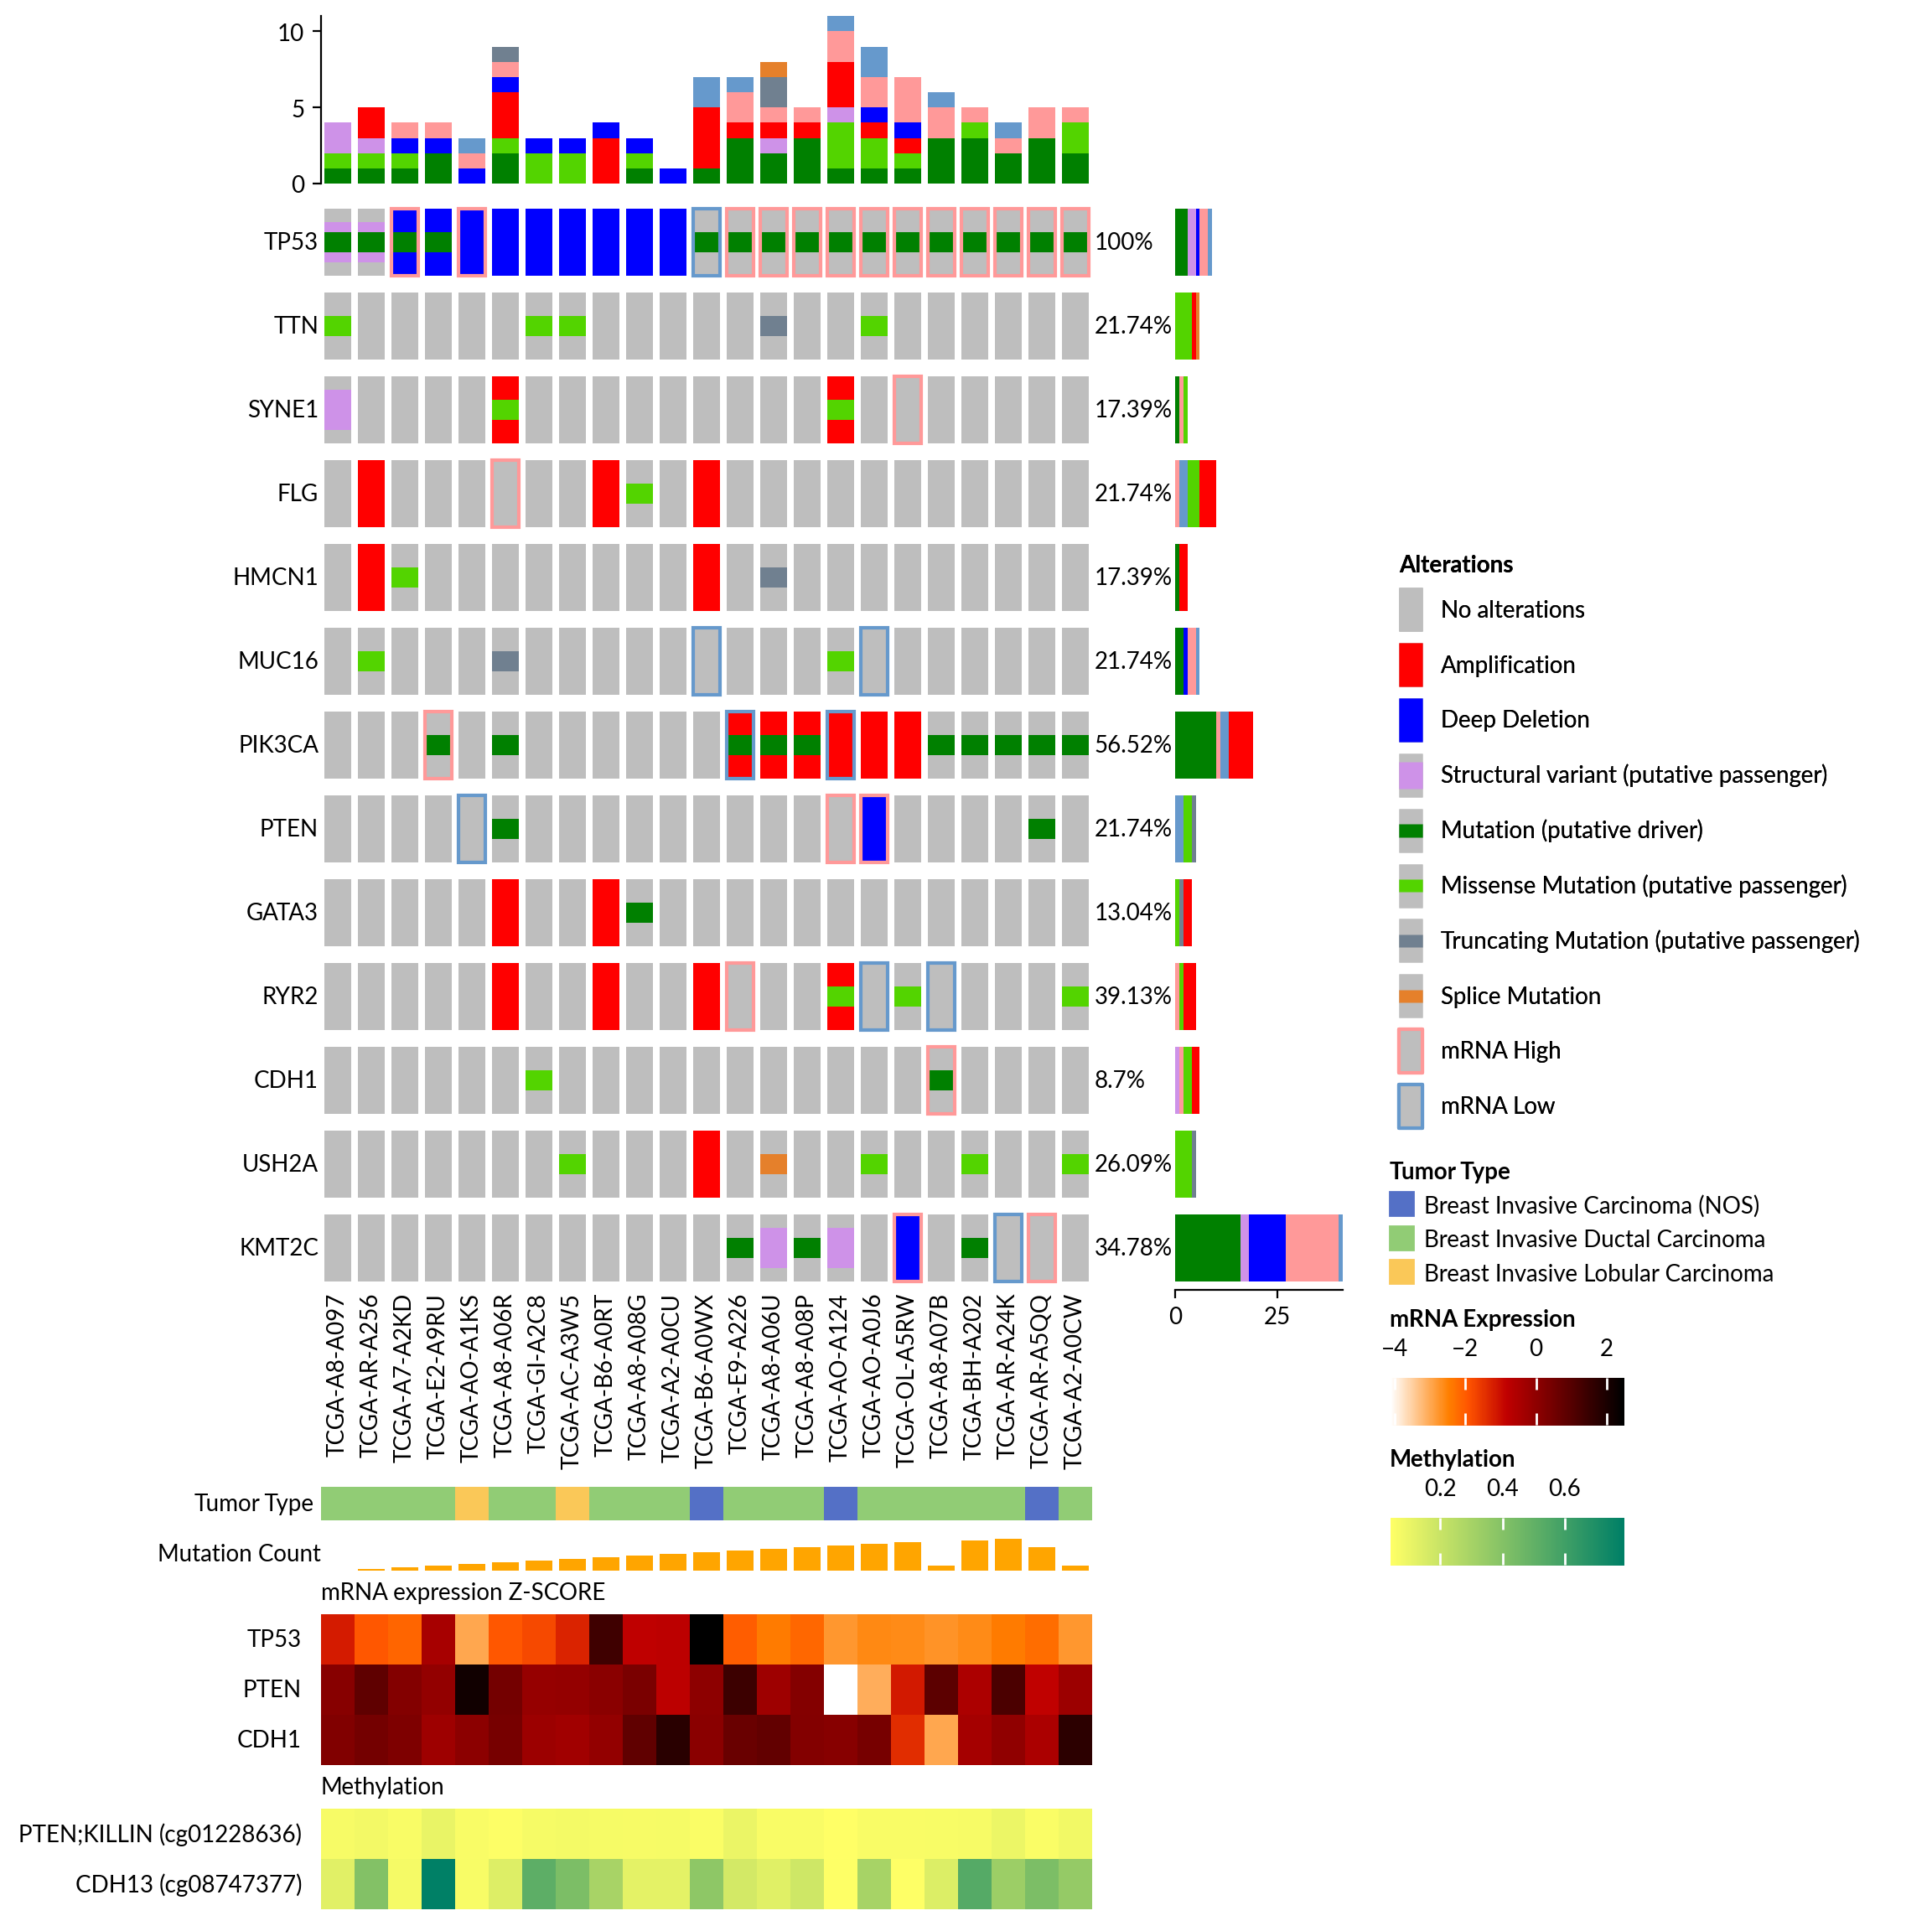
Append expression to the oncoprint
op /= h
op /= m
Render
op.set_margin(.2)
op.add_legends(box_padding=2, stack_size=4)
op.render()
mut_ax = op.get_ax("main", "mutation_count")
mut_ax.set_axis_off()
mut_ax.text(0, .5, "Mutation Count", rotation=0, ha="right",
            va="center", transform=mut_ax.transAxes)
plt.show()
Total running time of the script: (0 minutes 12.121 seconds)