Note
Go to the end to download the full example code.
Disabling the legend of a plot#
This example demonstrates how to disable the legend of a plot.
import numpy as np
import marsilea as ma

data = np.random.randint(0, 10, (10, 10))
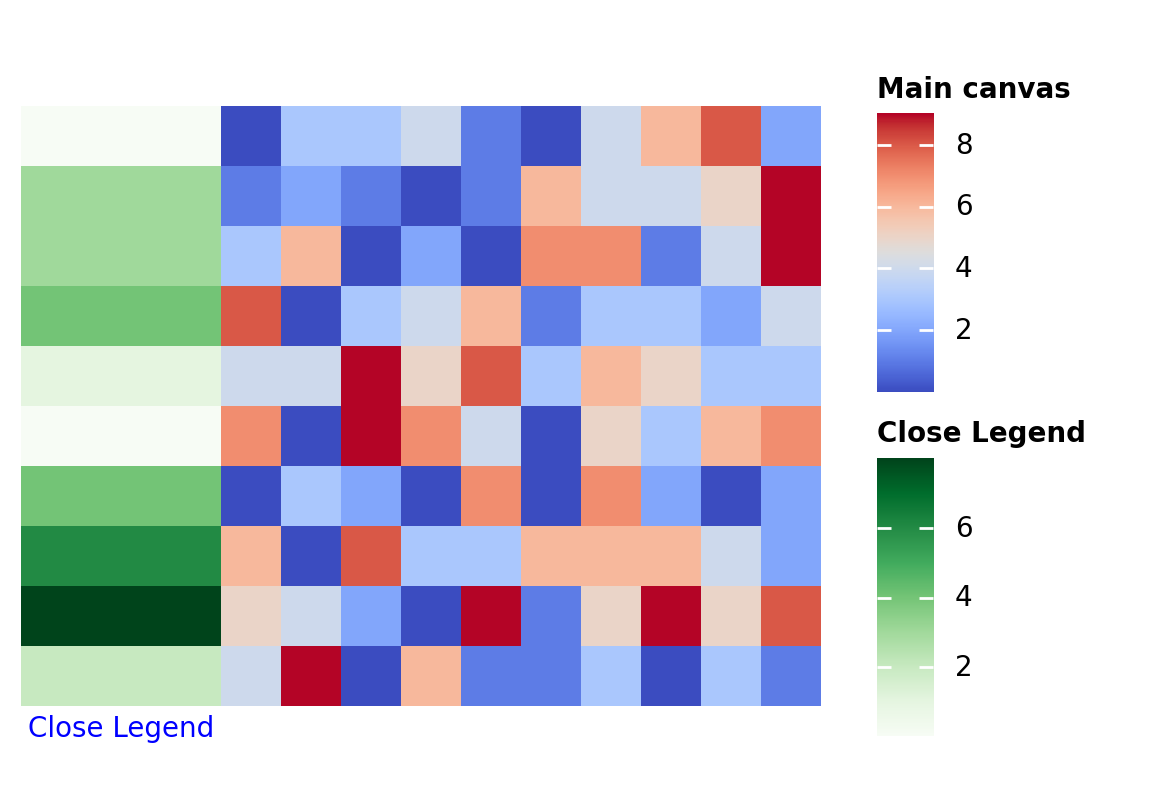
By default, the legend is enabled.
h = ma.Heatmap(data, width=3, height=3, label="Main canvas")
h.add_left(ma.plotter.ColorMesh(data[0], cmap="Greens", label="Close Legend"))
h.add_legends()
h.render()
<marsilea.heatmap.Heatmap object at 0x7416733e2d50>
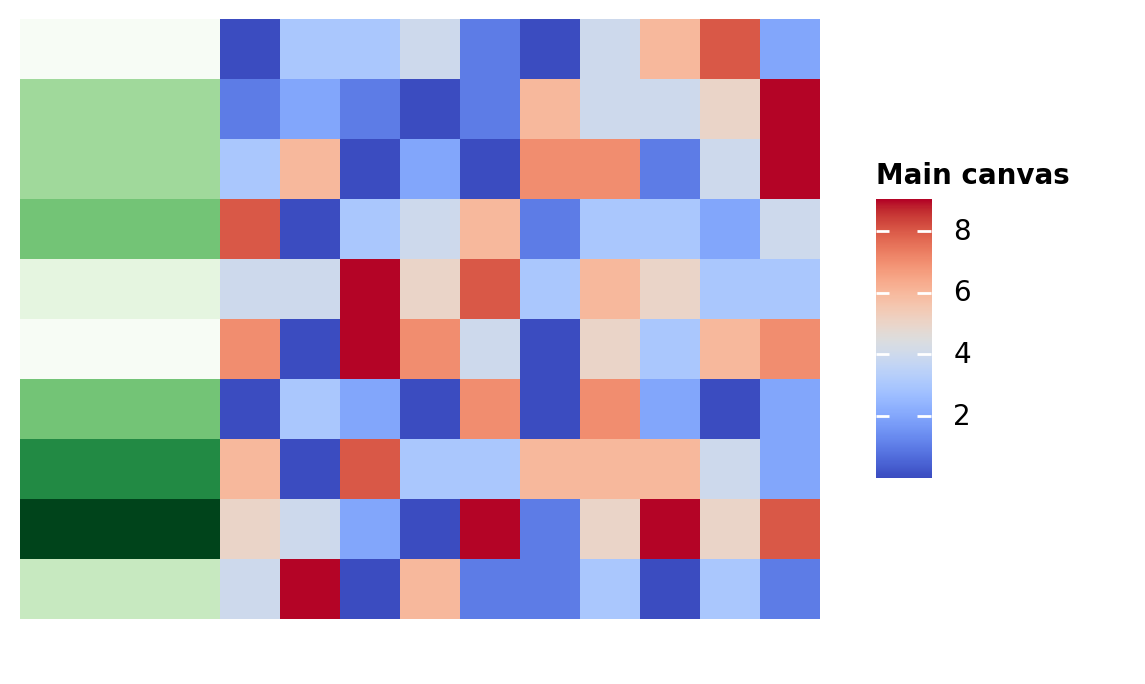
To disable the legend, set the legend parameter to False.
h = ma.Heatmap(data, width=3, height=3, label="Main canvas")
h.add_left(ma.plotter.ColorMesh(data[0], cmap="Greens"), legend=False)
h.add_legends()
h.render()
<marsilea.heatmap.Heatmap object at 0x741672fda270>
Total running time of the script: (0 minutes 0.466 seconds)