Note
Go to the end to download the full example code.
Figure Size and spacing#
Unlike other matplotlib plotting libraries, Marsilea gives you fine control over the size of the plot and the main canvas.
You don’t have to suffer from fixing the figure size and try to maintain the ratio among plots.
Note
The unit of the size is in inches.
import numpy as np
import marsilea as ma

data = np.random.randint(0, 10, (10, 10))
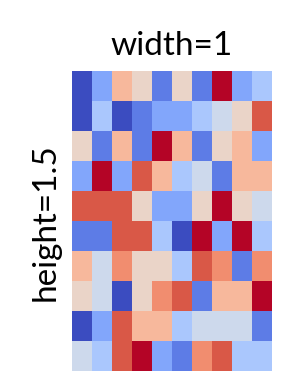
The size main canvas can be controlled via the width and height parameters.
h = ma.Heatmap(data, width=1, height=1.5)
h.add_title(top="width=1", left="height=1.5")
h.render()
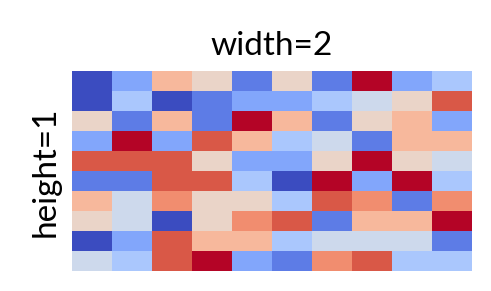
Let’s switch the width and height.
h = ma.Heatmap(data, width=2, height=1)
h.add_title(top="width=2", left="height=1")
h.render()
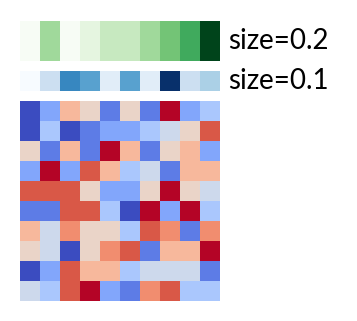
The size of the plotter can be controlled via the size parameter when you add to the main canvas.
blue = ma.plotter.ColorMesh(data[0], cmap="Blues", label="size=0.1")
green = ma.plotter.ColorMesh(data[1], cmap="Greens", label="size=0.2")

h = ma.Heatmap(data, width=1, height=1)
h.add_top(blue, size=0.1, pad=0.05)
h.add_top(green, size=0.2, pad=0.05)
h.render()
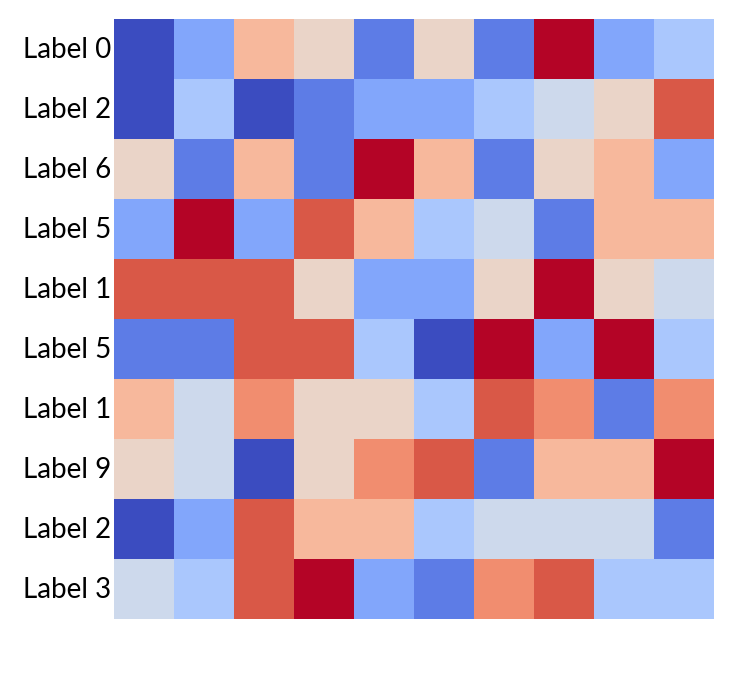
The size of text in Marsilea is automatically adjusted based on the content. But you can also set the size explicitly.
text = ma.plotter.Labels([f"Label {i}" for i in data[0]])

h = ma.Heatmap(data, width=3, height=3)
h.add_left(text)
h.render()
Total running time of the script: (0 minutes 0.318 seconds)