Note
Go to the end to download the full example code.
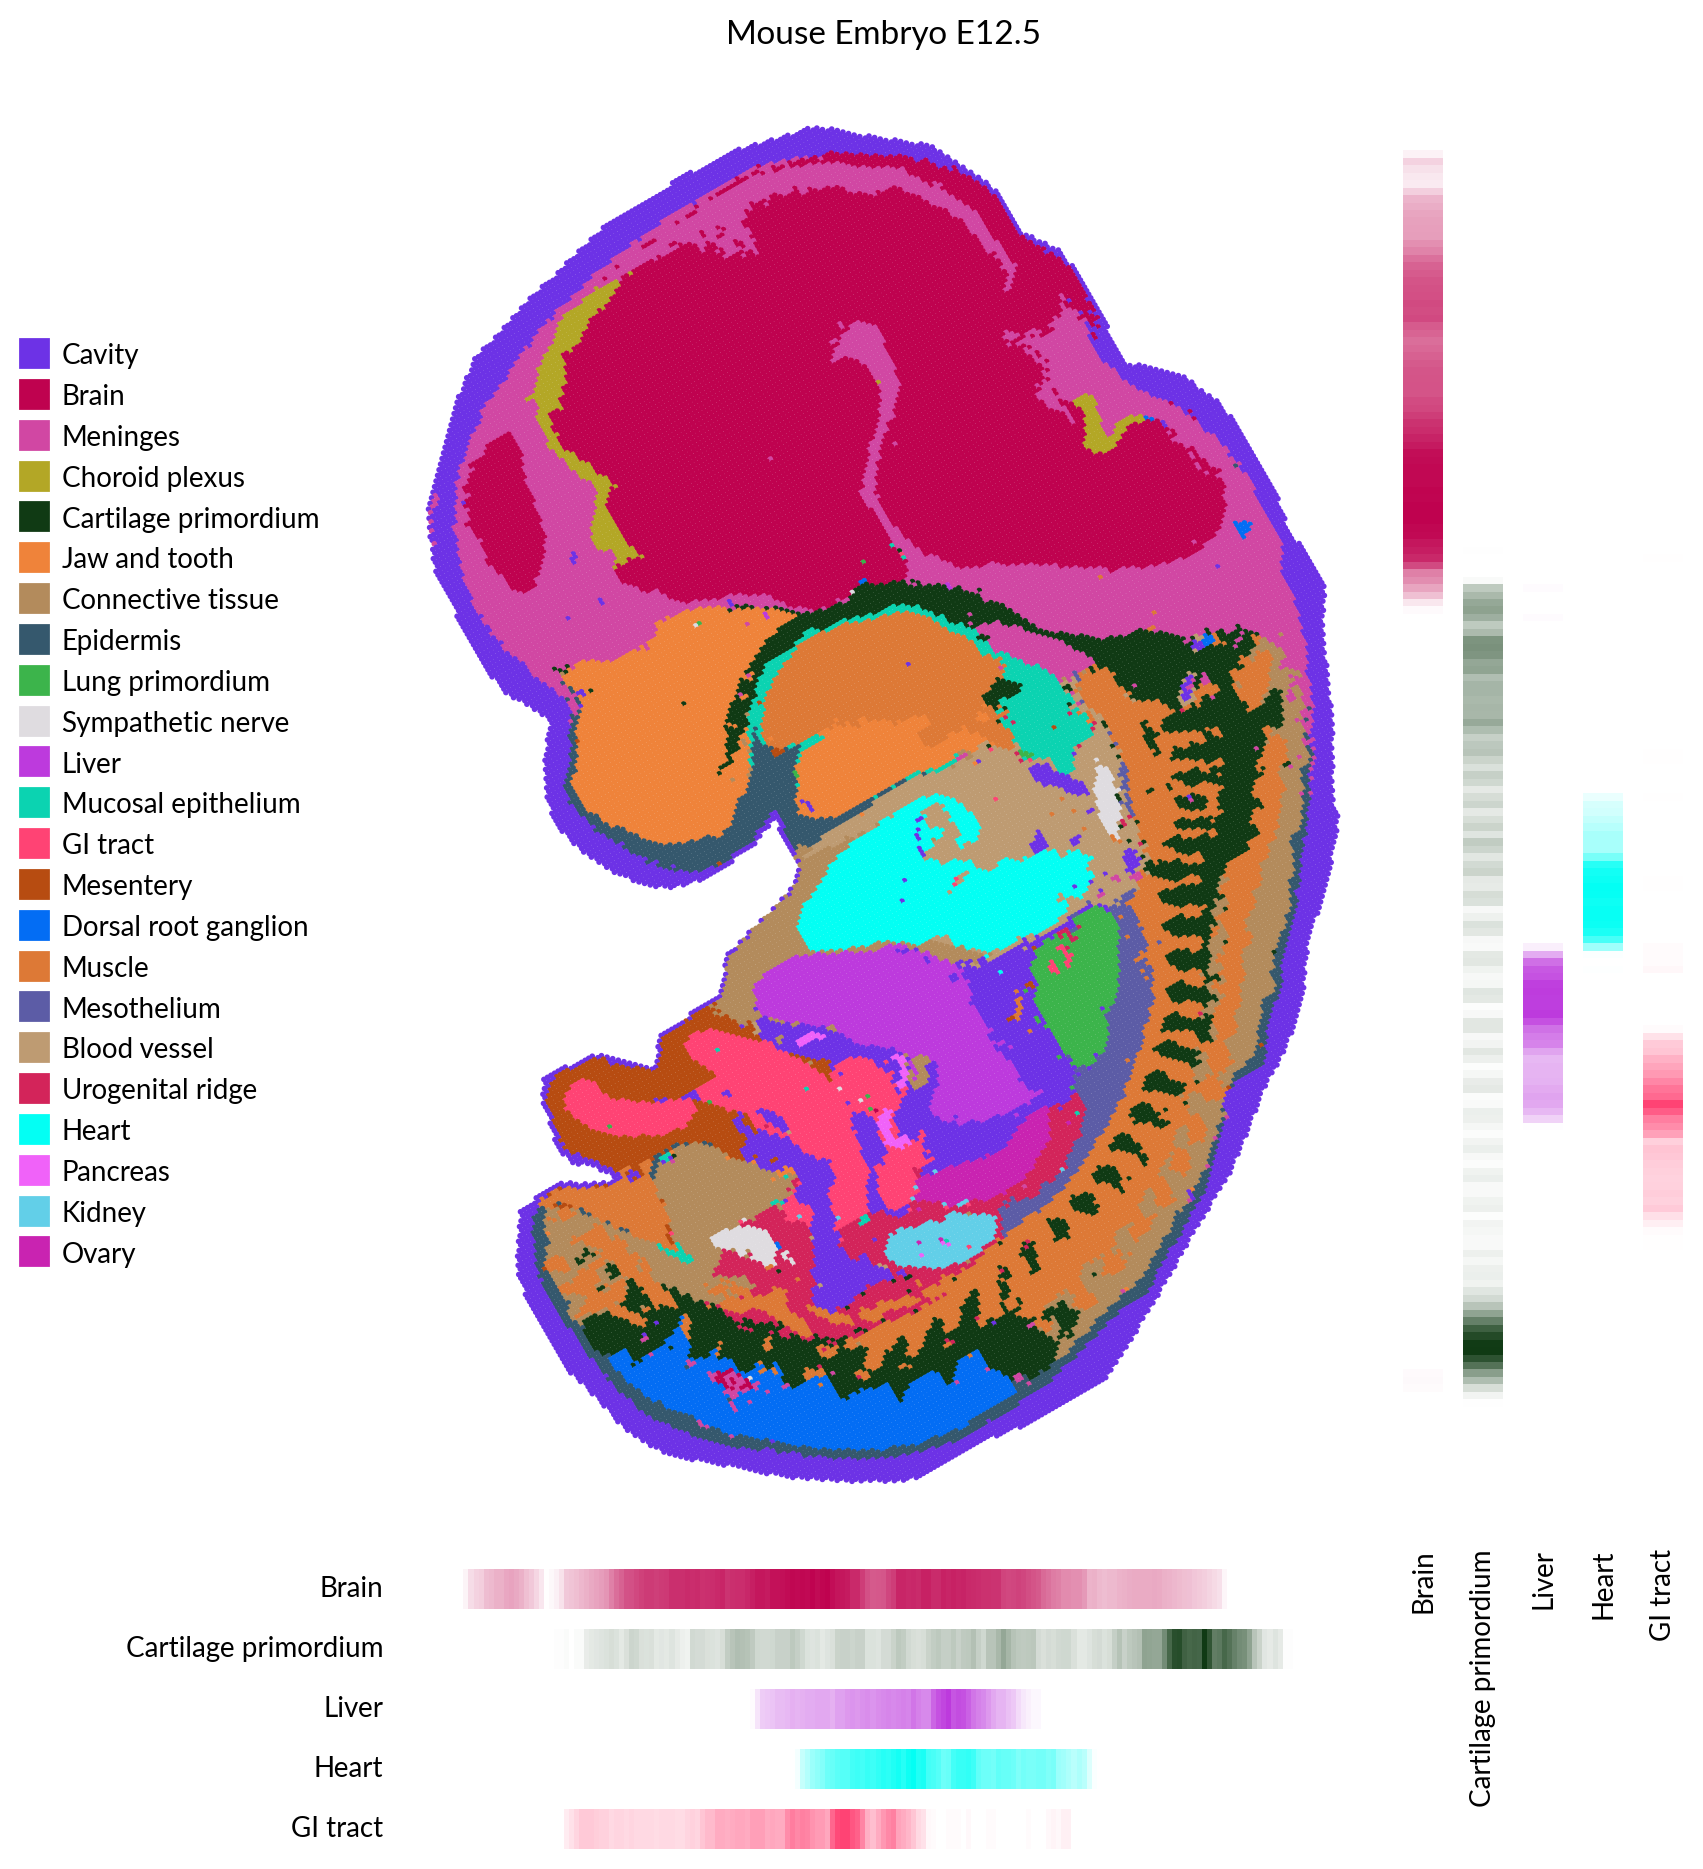
Mouse Embryo Map#
This example shows how to enhance a mouse embryo map.
Load dataset and prepare data#
import numpy as np
from matplotlib.colors import LinearSegmentedColormap
from legendkit import cat_legend
import marsilea as ma


embryo = ma.load_data("mouse_embryo")

xmax = embryo["cell_x"].max()
ymax = embryo["cell_y"].max()
xstart, xend = -xmax * 0.05, xmax * 1.05
ystart, yend = -ymax * 0.05, ymax * 1.05

xrange = np.linspace(xstart, xend, 200)
yrange = np.linspace(ystart, yend, 200)

xmid = (xrange[1:] + xrange[:-1]) / 2
ymid = (yrange[1:] + yrange[:-1]) / 2


def get_xy_hist(ct):
    x = embryo[embryo["cell_type"] == ct]["cell_x"].to_numpy()
    y = embryo[embryo["cell_type"] == ct]["cell_y"].to_numpy()
    xhist, _ = np.histogram(x, bins=xrange)
    yhist, _ = np.histogram(y, bins=yrange)
    return xhist, yhist
Here we have a predefined colormap for each cell type.
colormap = {
    "Cavity": "#6d32e6",
    "Brain": "#bf024f",
    "Meninges": "#d147a3",
    "Choroid plexus": "#b3a726",
    "Cartilage primordium": "#103a14",
    "Jaw and tooth": "#ef833a",
    "Connective tissue": "#b38b5c",
    "Epidermis": "#35586d",
    "Lung primordium": "#3cb44b",
    "Sympathetic nerve": "#dfdce0",
    "Liver": "#bd3add",
    "Mucosal epithelium": "#0bd3b1",
    "GI tract": "#ff4374",
    "Mesentery": "#b74c11",
    "Dorsal root ganglion": "#036df4",
    "Muscle": "#dd7936",
    "Mesothelium": "#5c5ca6",
    "Blood vessel": "#be9b72",
    "Urogenital ridge": "#d3245a",
    "Heart": "#03fff4",
    "Pancreas": "#f062f9",
    "Kidney": "#62cfe8",
    "Ovary": "#c923b1",
}

width = 5
height = width * (yend - ystart) / (xend - xstart)
b = ma.WhiteBoard(height=height, width=width)

cell_types = ["Brain", "Cartilage primordium", "Liver", "Heart", "GI tract"]
for n in cell_types:
    b.add_canvas("bottom", size=0.2, pad=0.1, name=f"{n}-x")
    b.add_canvas("right", size=0.2, pad=0.1, name=f"{n}-y")
b.render()

# Draw cell
ax = b.get_main_ax()
points = ax.scatter(embryo["cell_x"], embryo["cell_y"], s=1, c=embryo["colors"])
points.set_rasterized(True)
ax.set_xlim(xstart, xend)
ax.set_ylim(ystart, yend)
ax.set_title("Mouse Embryo E12.5")
ax.set_axis_off()

colors = list(colormap.values())
labels = list(colormap.keys())
cat_legend(colors=colors, labels=labels, ax=ax, loc="out left center", fontsize=10)

for n in cell_types:
    xh, yh = get_xy_hist(n)
    cmap = LinearSegmentedColormap.from_list(n, ["white", colormap[n]])
    x_ax = b.get_ax(f"{n}-x")
    x_ax.pcolormesh(xh.reshape(1, -1), cmap=cmap)
    x_ax.set_axis_off()
    x_ax.text(0, 0.5, n, va="center", ha="right", transform=x_ax.transAxes)

    y_ax = b.get_ax(f"{n}-y")
    y_ax.pcolormesh(yh.reshape(-1, 1), cmap=cmap)
    y_ax.set_axis_off()
    y_ax.text(0.5, 0, n, va="top", ha="center", rotation=90, transform=y_ax.transAxes)


# sphinx_gallery_ignore_start
if "__file__" in globals():
    from pathlib import Path
    import matplotlib.pyplot as plt

    plt.rcParams["svg.fonttype"] = "none"
    save_path = Path(__file__).parent / "imgs"
    plt.savefig(save_path / "mouse_embryo.svg", bbox_inches="tight")
    plt.savefig(save_path / "mouse_embryo.png", dpi=300, bbox_inches="tight")
# sphinx_gallery_ignore_end
Total running time of the script: (0 minutes 2.154 seconds)