Concatenate Multiple Cross-layouts#
For situations where a single cross-layout is insufficient to demonstrate your data, you may want to concatenate multiple cross-layouts together.
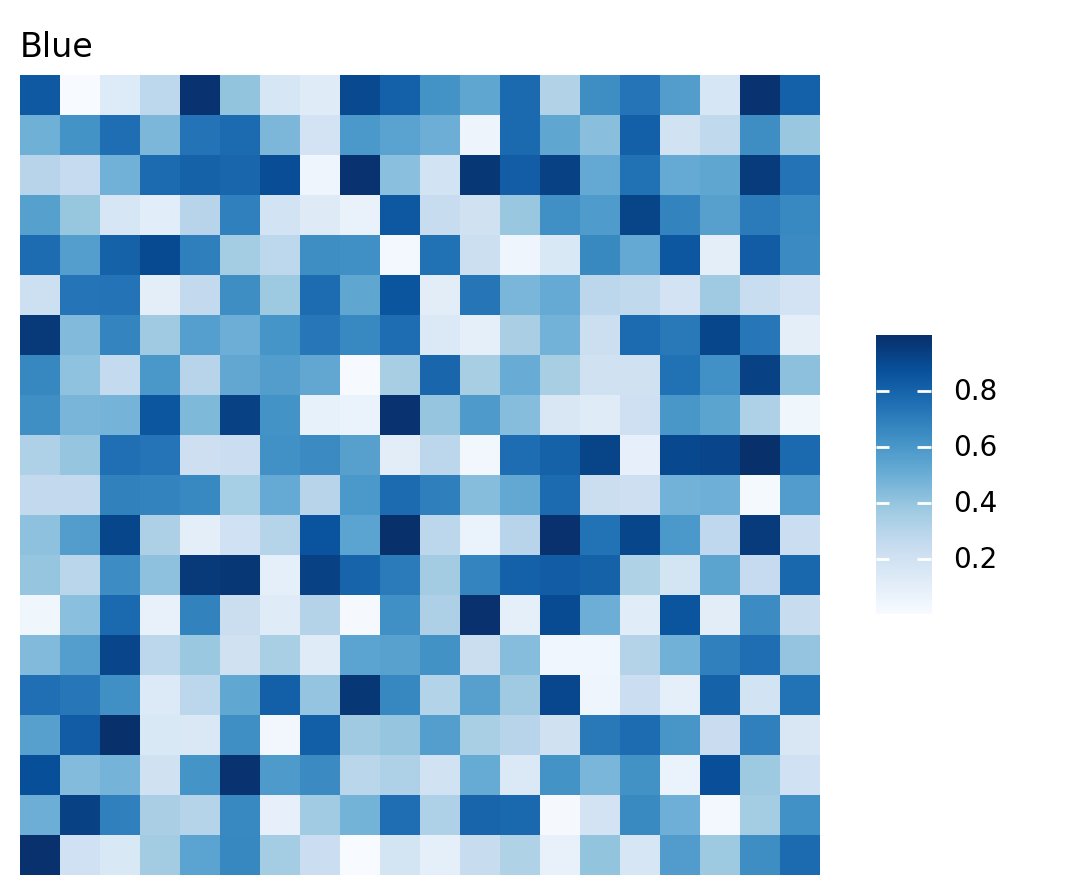
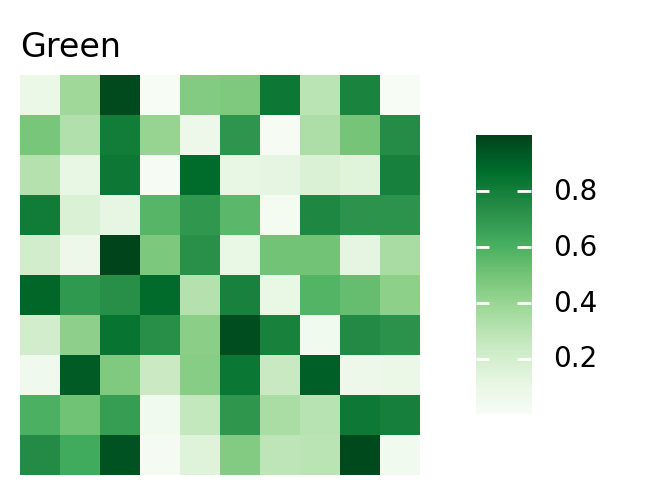
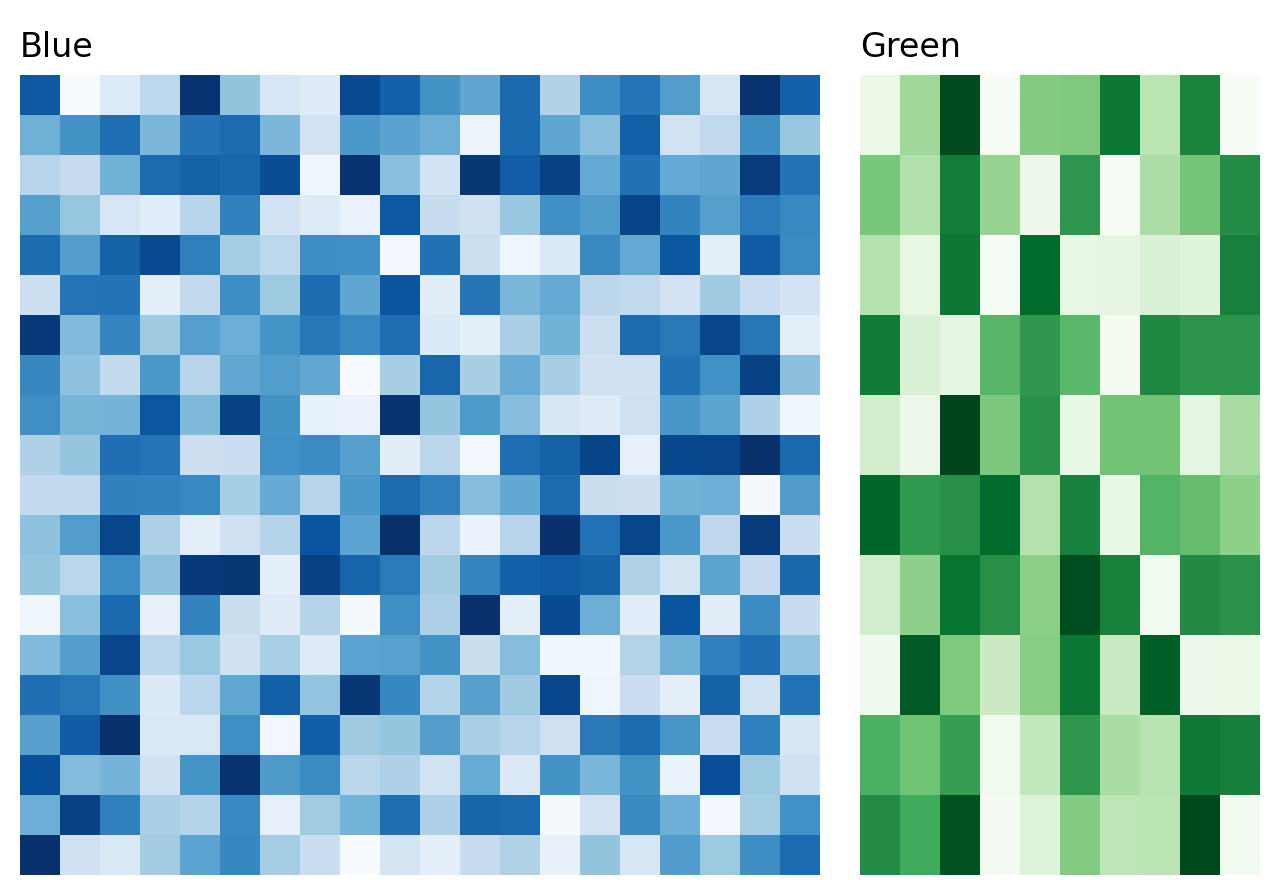
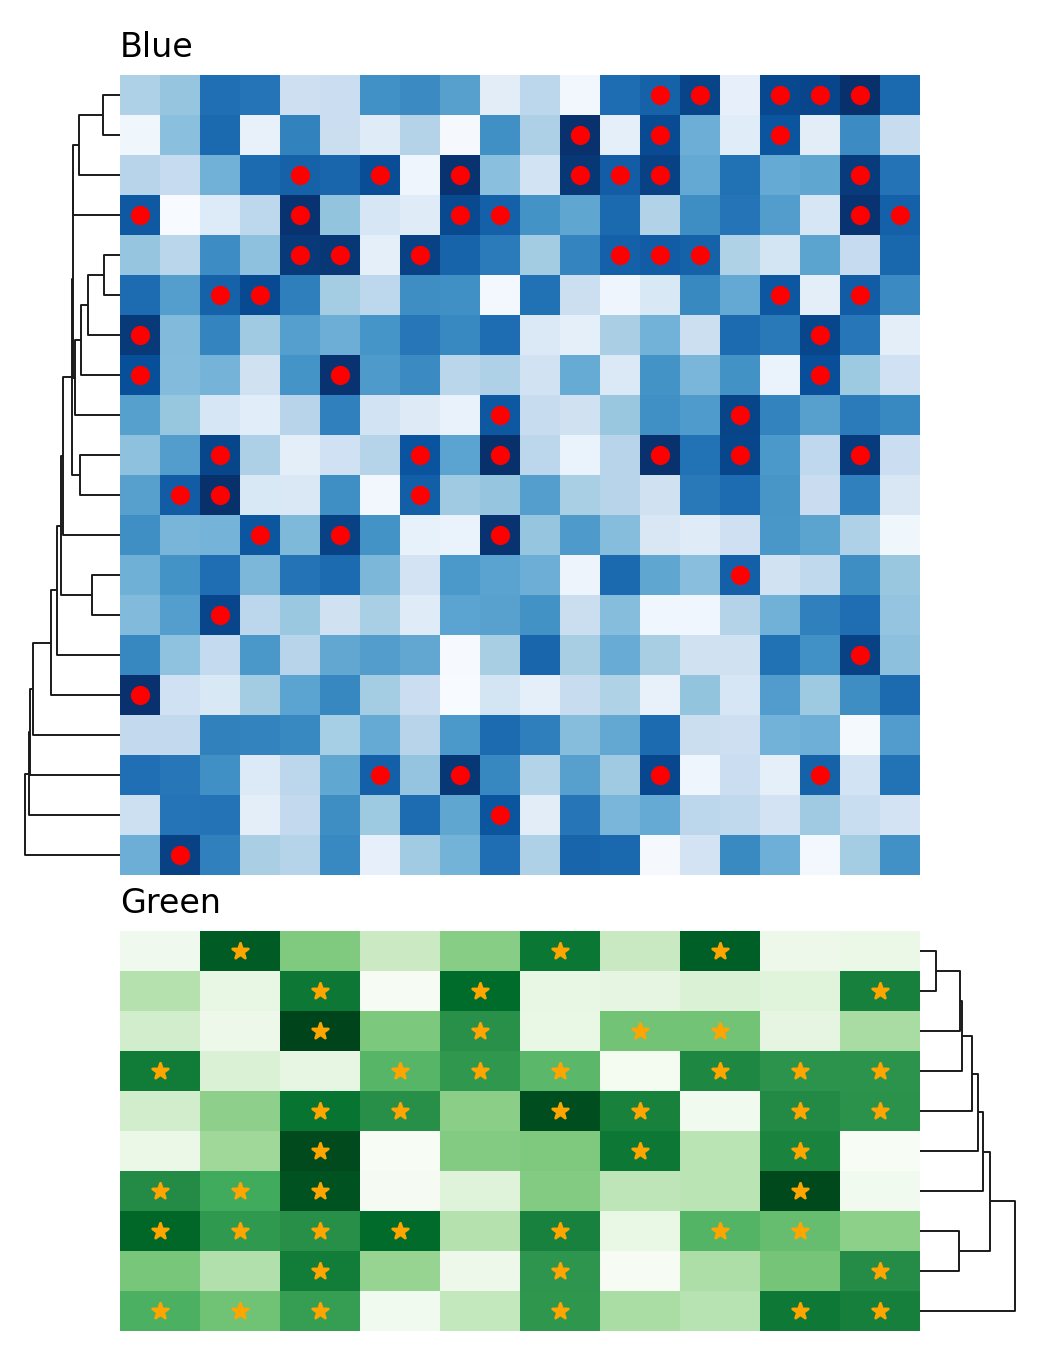
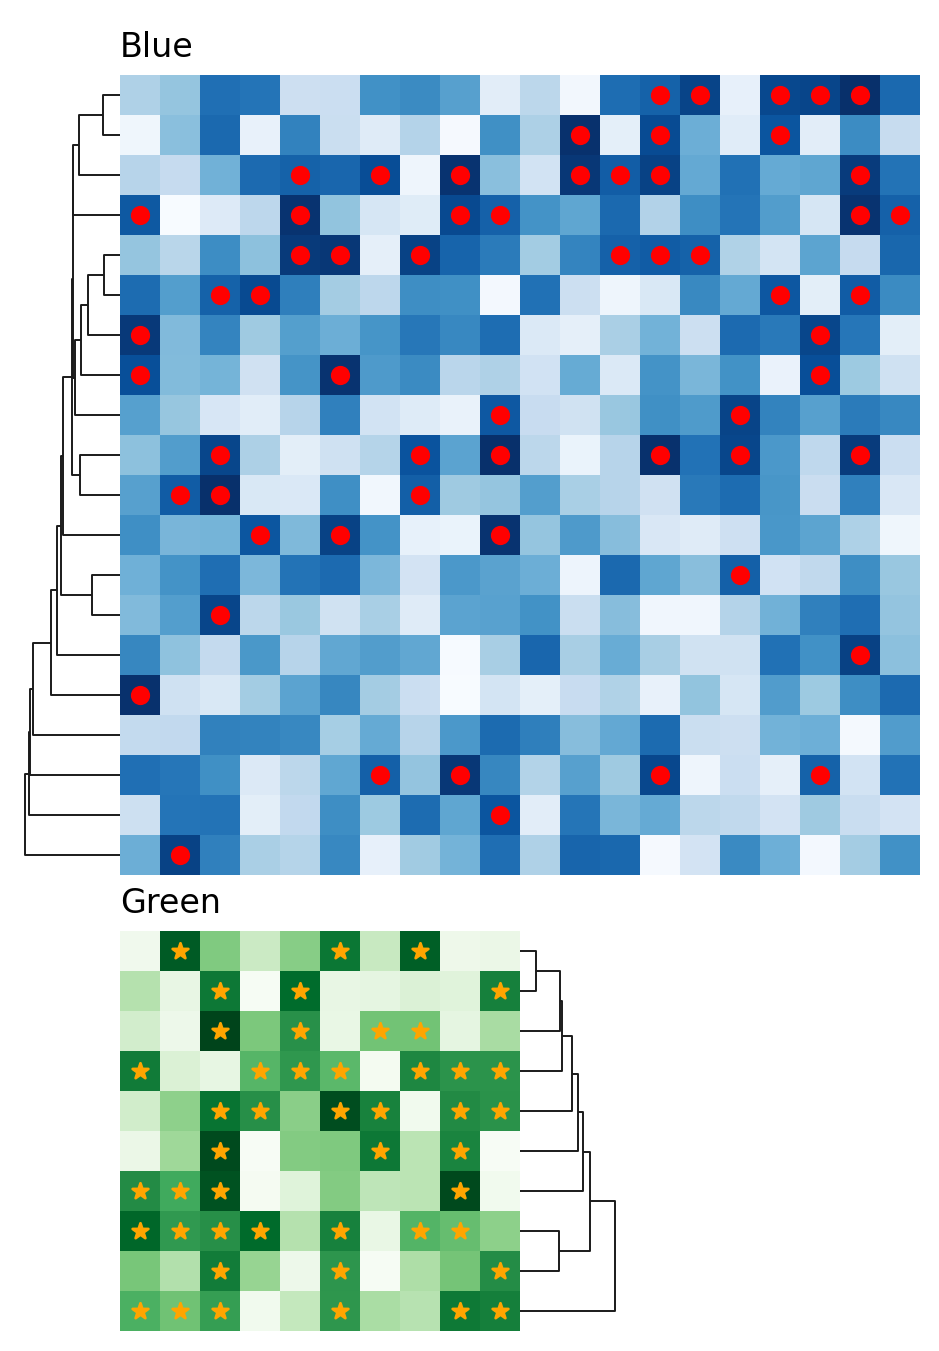
Suppose you have a blue heatmap and a green heatmap, as shown below:
>>> import marsilea as ma
>>> data1 = np.random.rand(20, 20)
>>> h1 = ma.Heatmap(data1, cmap="Blues", width=4, height=4, name="h1")
>>> h1.add_title(top="Blue", align="left")
>>> h1.add_legends()
>>> h1.render()
>>> data2 = np.random.rand(10,10)
>>> h2 = ma.Heatmap(data2, cmap="Greens", width=2, height=2, name="h2")
>>> h2.add_title(top="Green", align="left")
>>> h2.add_legends()
>>> h2.render()
To concatenate heatmaps horizontally, simply use the add operator +.
>>> (h1 + h2).render()
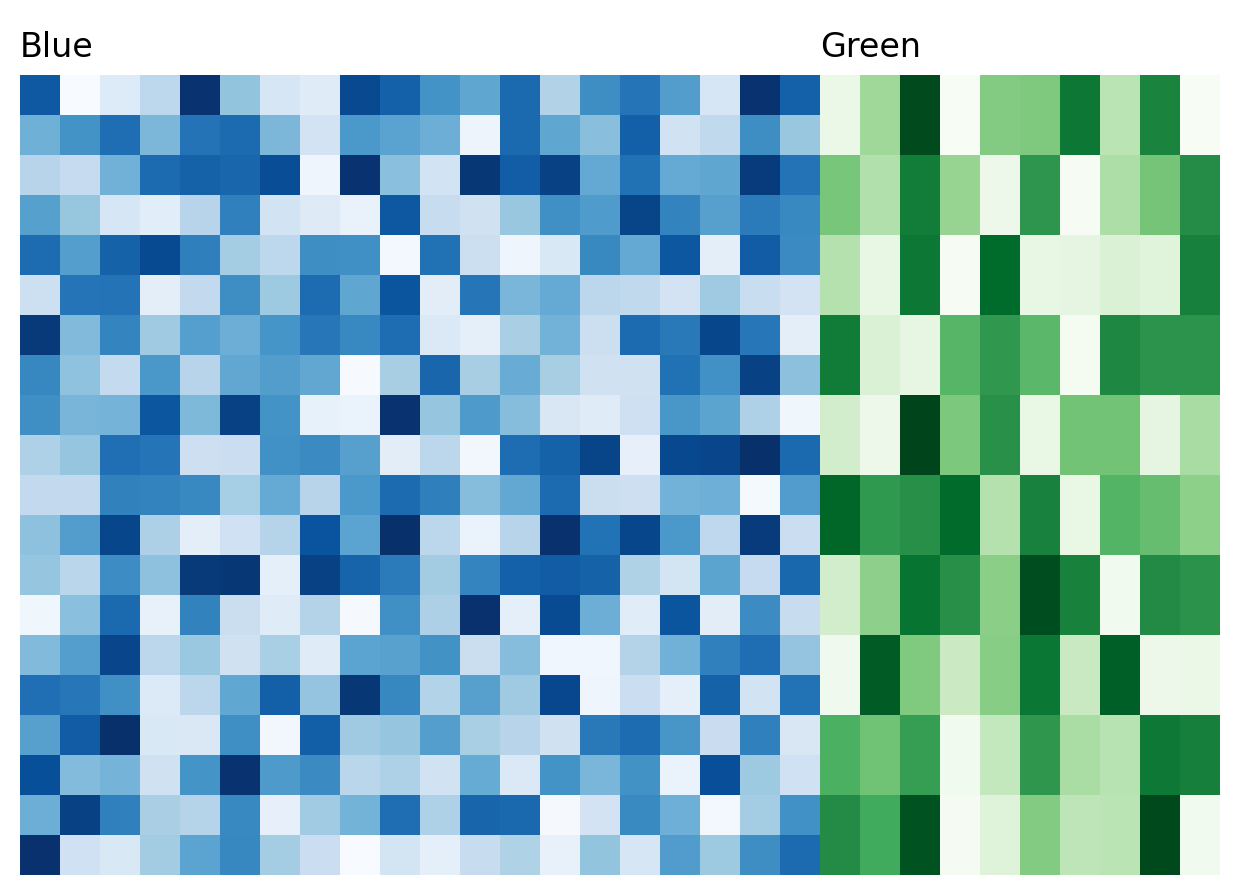
But if the heatmaps appear too close together, you can add space between them by including a number:
>>> (h1 + .2 + h2).render()
For vertical concatenation, use the divide operator /:
>>> (h1 / .2 / h2).render()
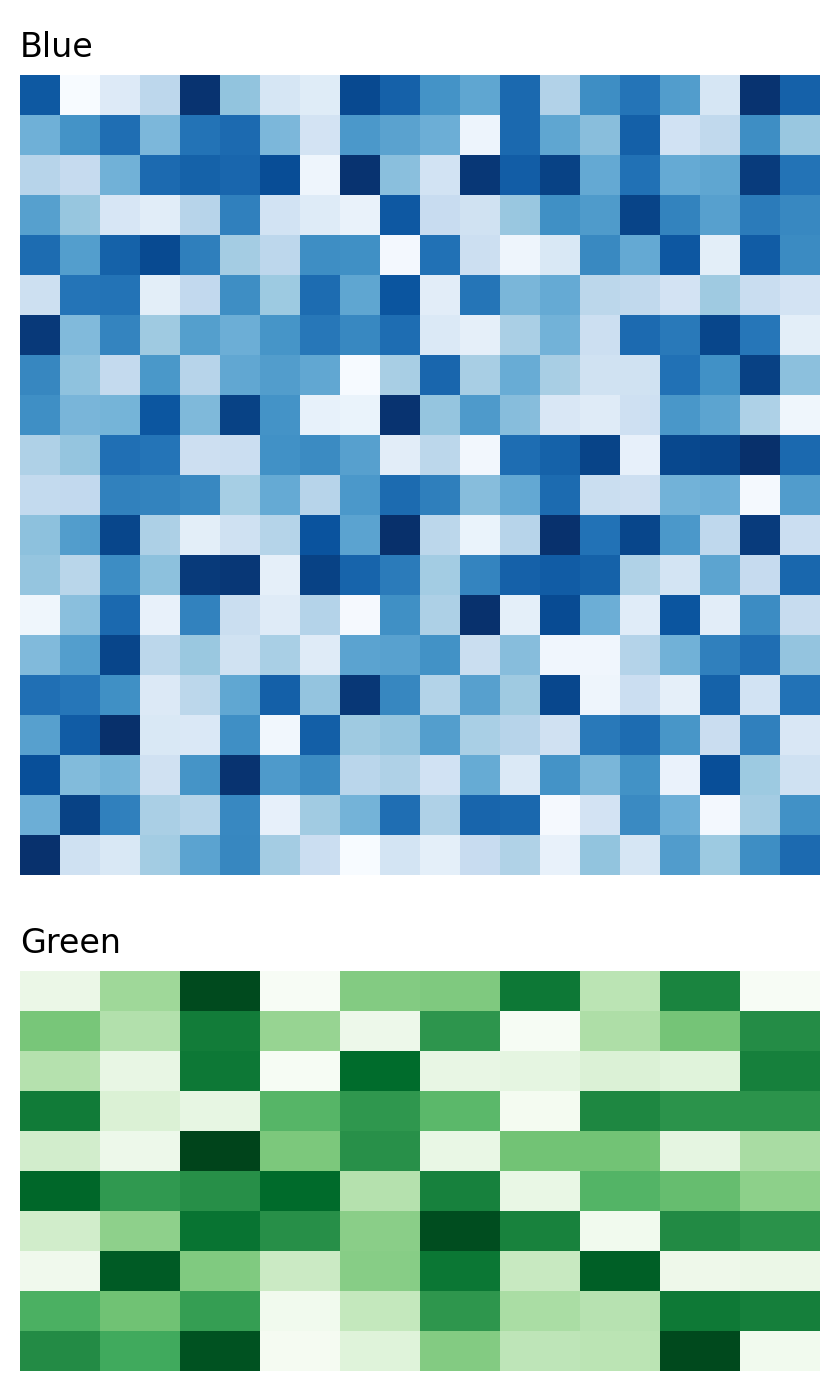
Take note that when concatenating,
the width of the secondary heatmap(s) will be adjusted to match the main heatmap’s layout.
For example, the width of h2 becomes 5 to match h1
Legends#
Marsilea can effectively rearrange legends from all your heatmaps.
Here, the concatenated result has legends added to the left side using
the add_legends() method.
>>> c = (h1 + .2 + h2)
>>> c.add_legends()
>>> c.render()
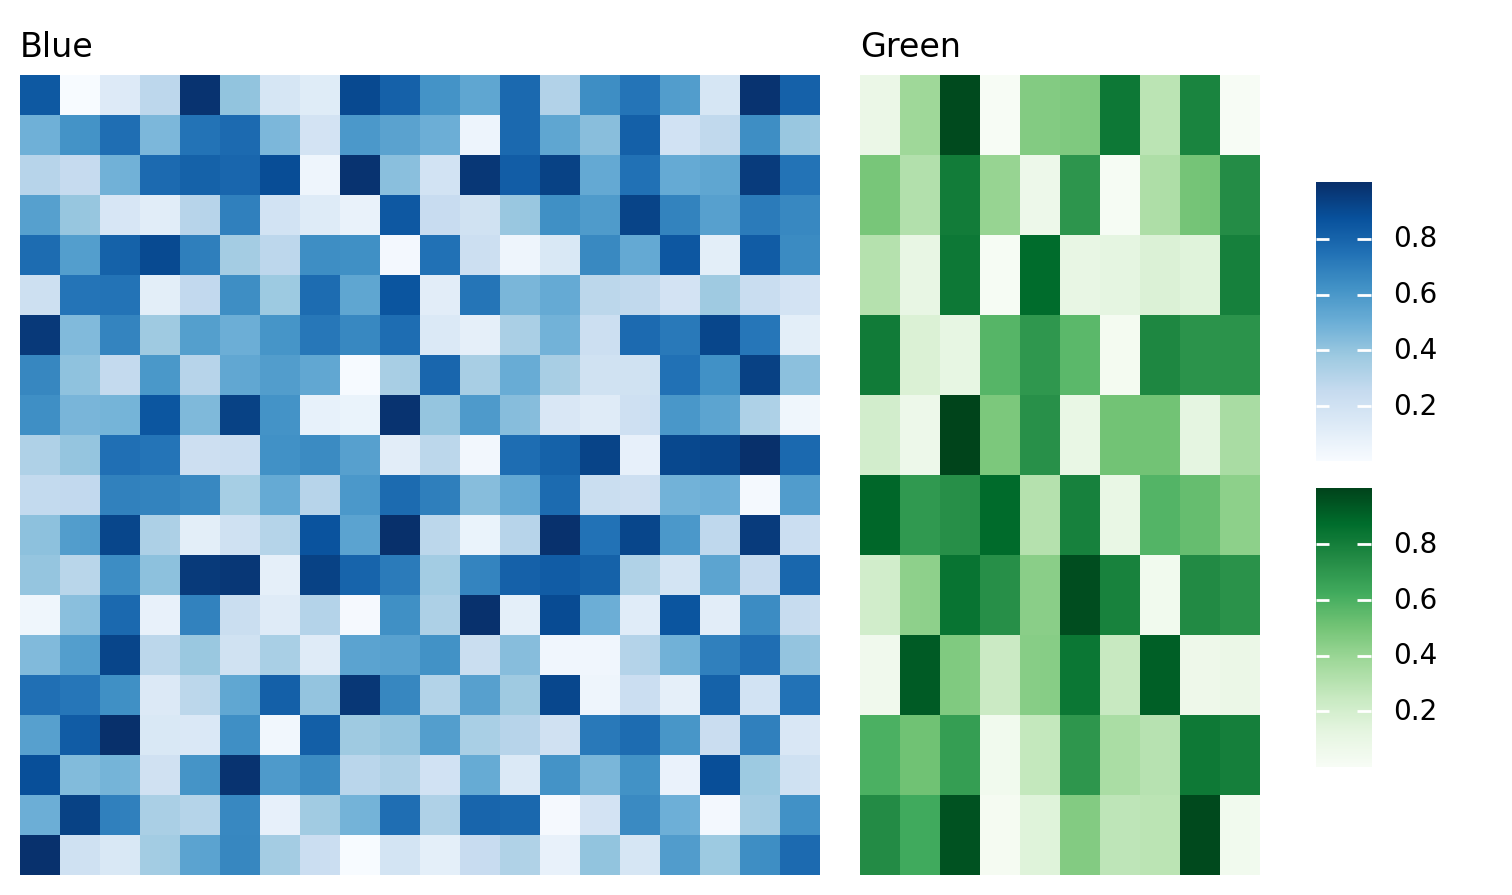
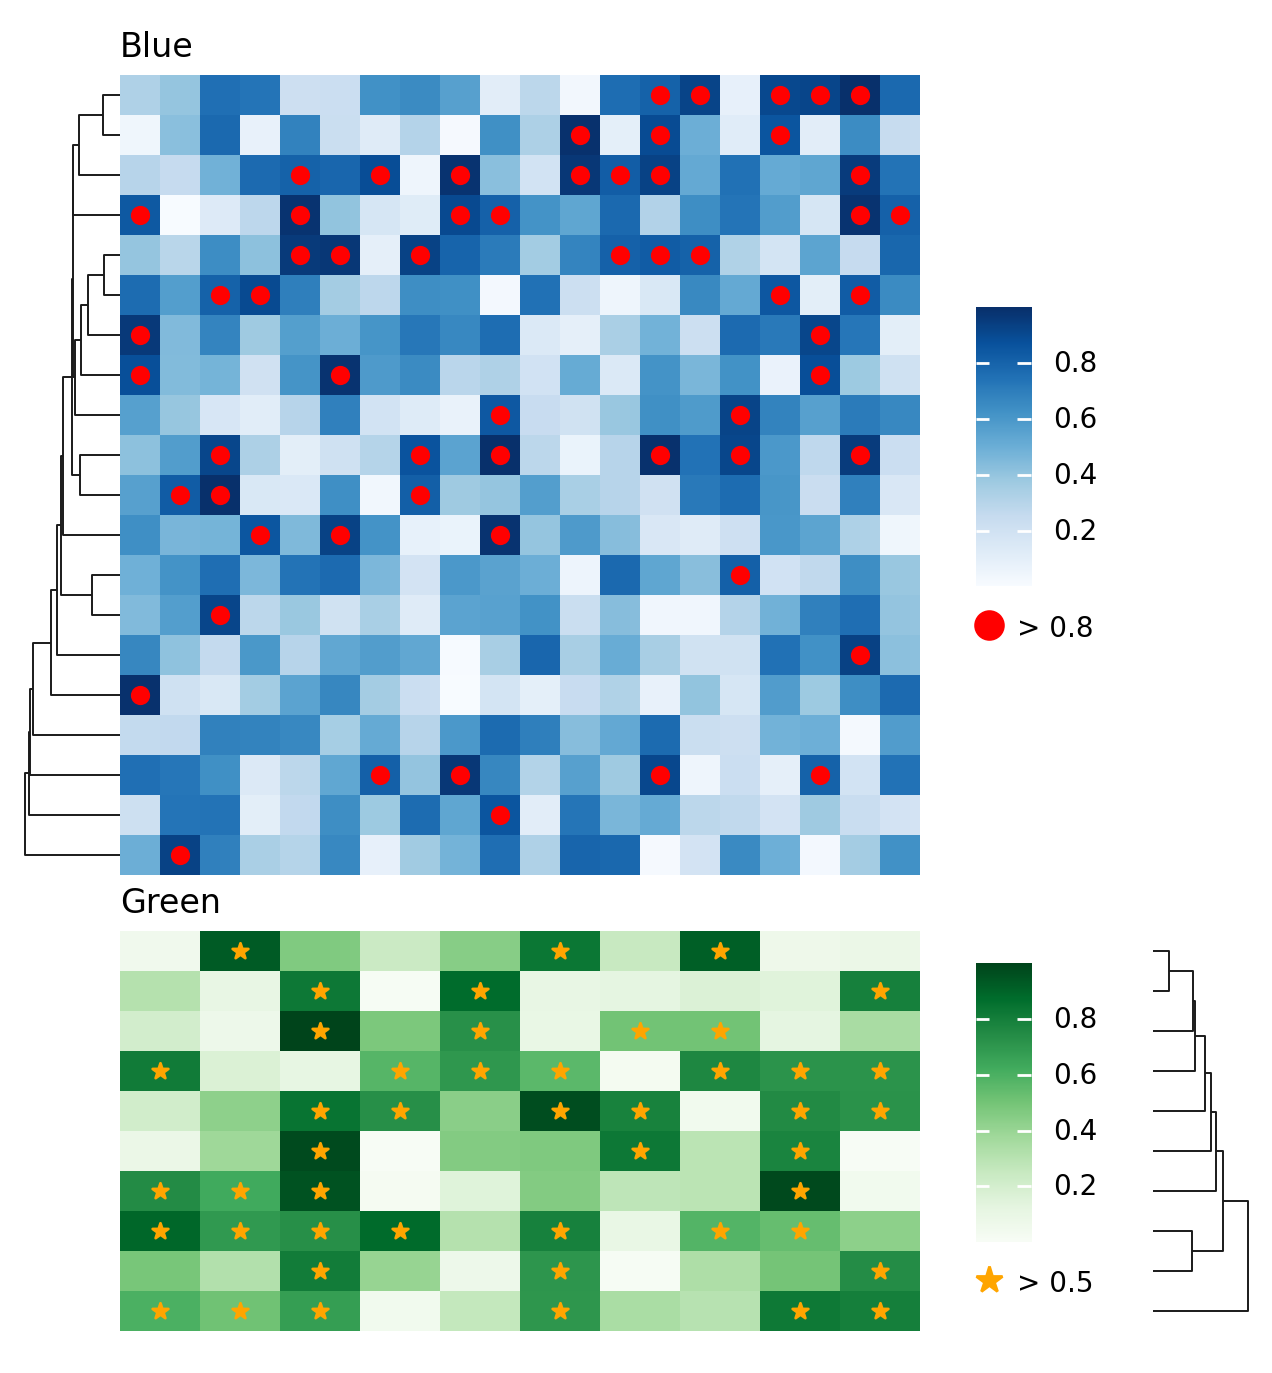
The example also demonstrates how to arrange multiple legends.
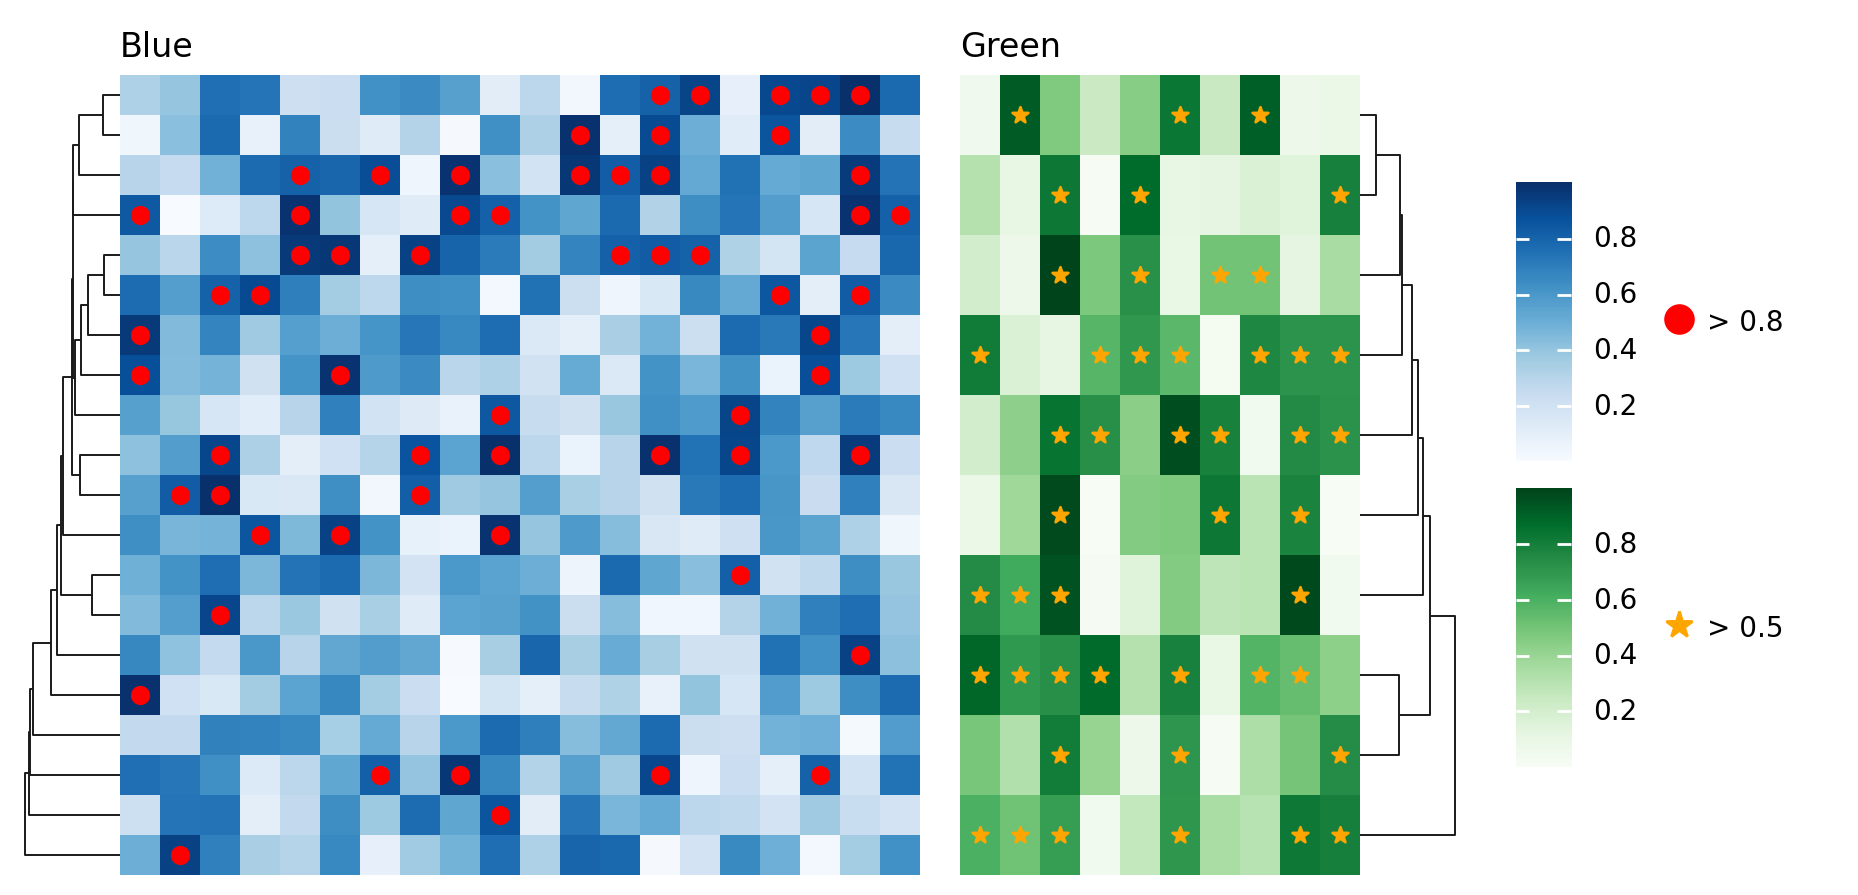
>>> from marsilea.plotter import MarkerMesh
>>> h1.add_dendrogram("left")
>>> h2.add_dendrogram("right")
>>> layer1 = MarkerMesh(data1 > 0.8, color='red', marker='o', label="> 0.8")
>>> layer2 = MarkerMesh(data2 > 0.5, color='orange', label="> 0.5")
>>> h1.add_layer(layer1, name='marker1')
>>> h2.add_layer(layer2, name='marker2')
>>> c = h1 + .2 + h2
>>> c.add_legends(side="right", order=["h1", "marker1", "h2", "marker2"],
...               stack_by='row', stack_size=2, align_legends='center')
>>> c.render()
Advanced#
To get finer control over your concatenation, you can use marsilea.base.CompositeBoard,
which is a cross-layout for cross-layouts instead of plots. The result of + or / operations
is a marsilea.base.CompositeBoard object.
>>> c = ma.CompositeBoard(h1)
>>> c.append("bottom", h2, pad=.2)
>>> c.render()
By default, the size of the appended heatmap will be forced to aligned with the main heatmap.
You can change this behavior by setting align=False:
>>> c = ma.CompositeBoard(h1, align_main=False)
>>> c.append("bottom", h2, pad=.2)
>>> c.render()
If you want to keep the legends within each heatmap, you can set keep_legends=True:
>>> c = ma.CompositeBoard(h1, keep_legends=True)
>>> c.append("bottom", h2, pad=.2)
>>> c.render()