Note
Go to the end to download the full example code.
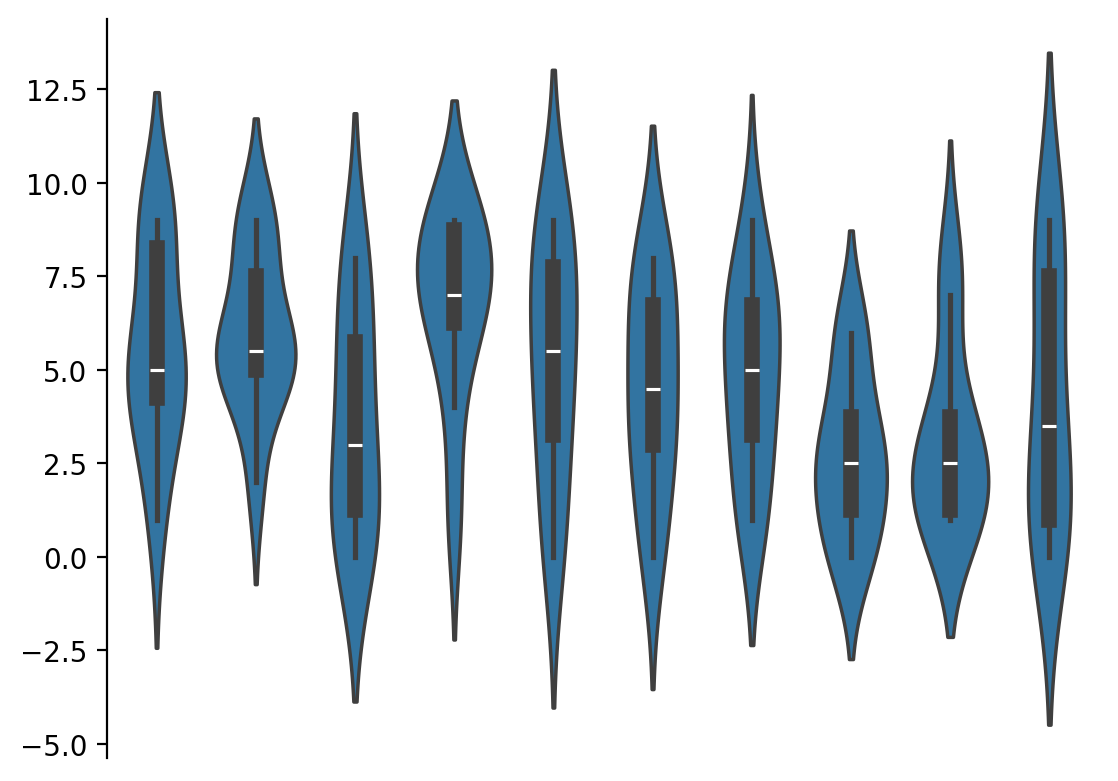
Violin#
Violin is a wrapper for seaborn’s violinplot.
from marsilea.plotter import Violin
import numpy as np
import matplotlib.pyplot as plt

_, ax = plt.subplots()
data = np.random.randint(0, 10, (10, 10))
Violin(data).render(ax)
Total running time of the script: (0 minutes 0.305 seconds)