Ctrl+K
marsilea 0.5.1 documentation - Home marsilea 0.5.1 documentation - Home
  • Tutorial
  • Gallery
  • API
  • Installation
  • How-To
  • GitHub
  • Tutorial
  • Gallery
  • API
  • Installation
  • How-To
  • GitHub

Section Navigation

  • Basics
    • Grouped heatmap
    • Heatmap
    • Annotate stacked bar
    • Two Heatmaps
  • All Plotters
    • AnnoLabels
    • Arc
    • Area
    • Bar
    • Box
    • Boxen
    • CenterBar
    • Chunk
    • ColorMesh
    • Colors
    • Emoji
    • FixedChunk
    • Image
    • Labels
    • MarkerMesh
    • Numbers
    • Point
    • Range
    • SeqLogo
    • SizedMesh
    • StackBar
    • Strip
    • Swarm
    • TextMesh
    • Title
    • Violin
  • Real World Data Visualization
    • Les Miserables Arc Diagram
    • Current available plotters in Marsilea
    • Bivariate Distribution
    • Mouse Embryo Map
    • Fat content in cooking oils
    • Breast cancer mutation with Oncoprinter
    • Visualizing Single-cell RNA-seq Data
    • Visualizing Single-cell Multi-Omics Data
    • Sequence Alignment Plot
    • Ranking of programming languages.
    • Track Plot
    • Upset Plot
  • Gallery
  • All Plotters

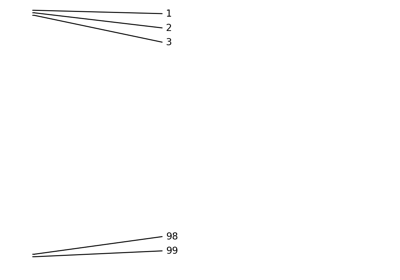
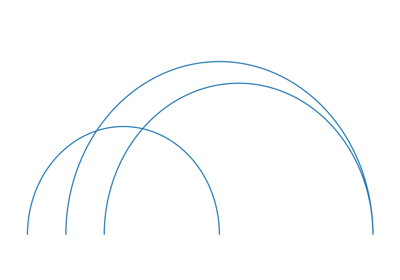
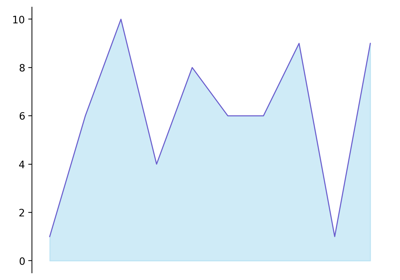
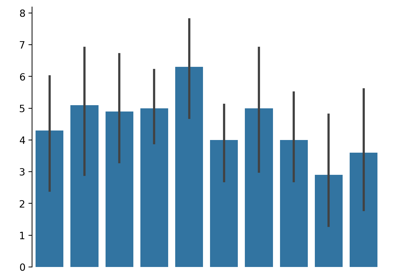
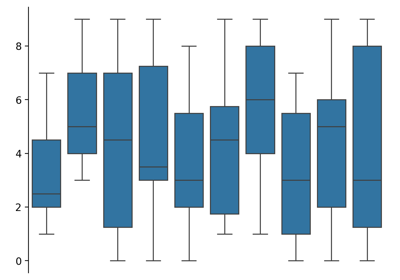
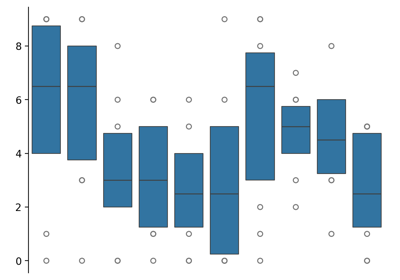
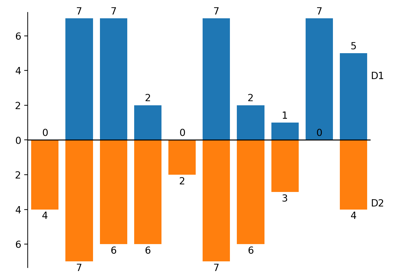
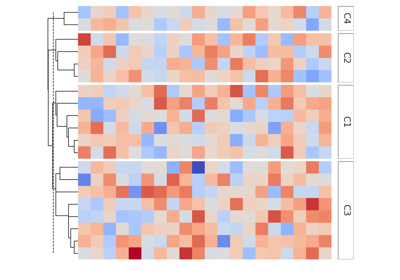
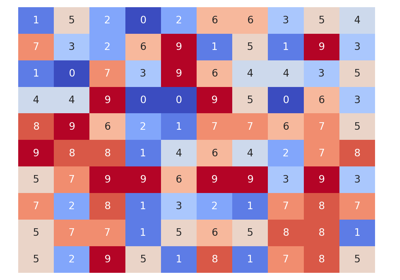
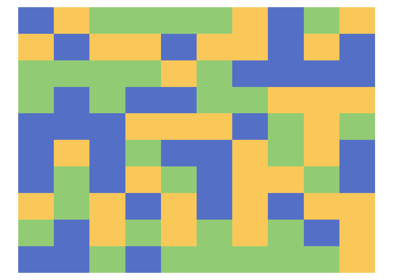
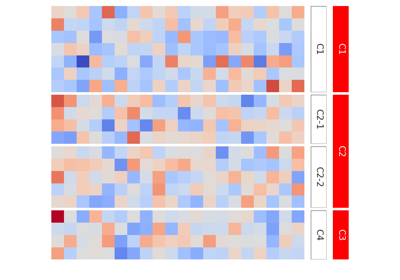
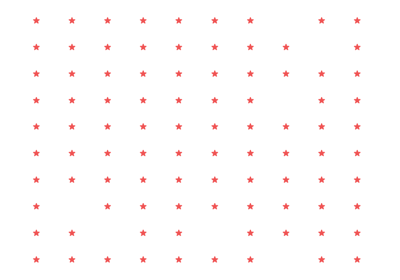
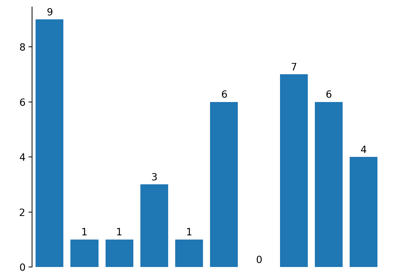
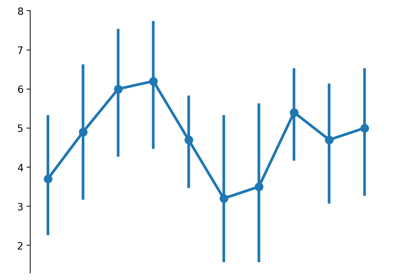
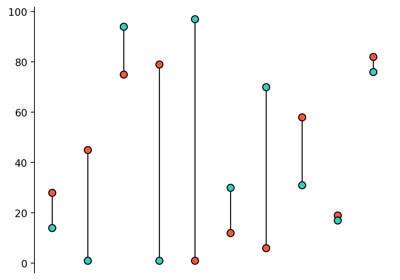
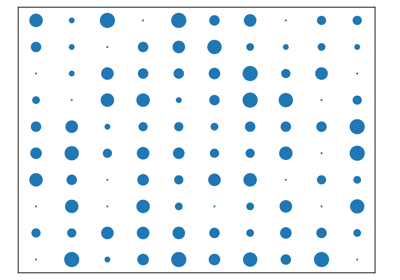
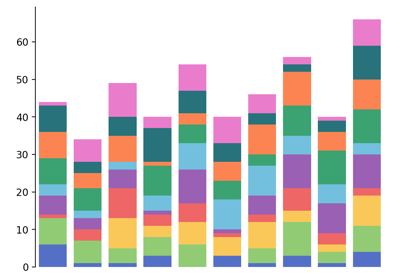
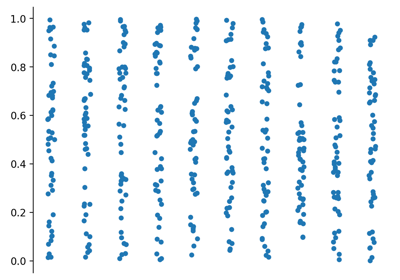
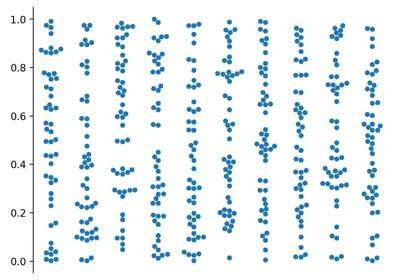
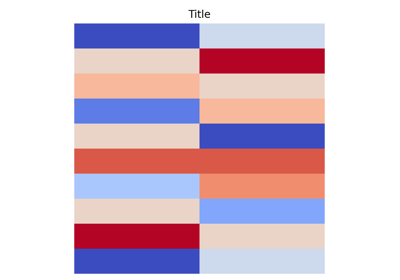
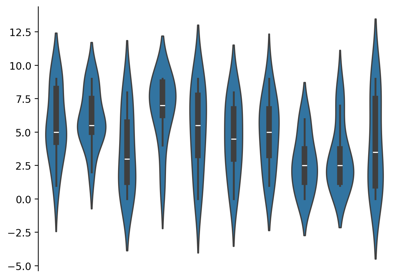
All Plotters#

Examples of all available plotters in Marsilea.

AnnoLabels

AnnoLabels

Arc

Arc

Area

Area

Bar

Bar

Box

Box

Boxen

Boxen

CenterBar

CenterBar

Chunk

Chunk

ColorMesh

ColorMesh

Colors

Colors

Emoji

Emoji

FixedChunk

FixedChunk

Image

Image

Labels

Labels

MarkerMesh

MarkerMesh

Numbers

Numbers

Point

Point

Range

Range

SeqLogo

SeqLogo

SizedMesh

SizedMesh

StackBar

StackBar

Strip

Strip

Swarm

Swarm

TextMesh

TextMesh

Title

Title

Violin

Violin

previous

Two Heatmaps

next

AnnoLabels

© Copyright 2025, Mr-Milk.

Created using Sphinx 8.1.3.

Built with the PyData Sphinx Theme 0.16.1.