Note
Go to the end to download the full example code.
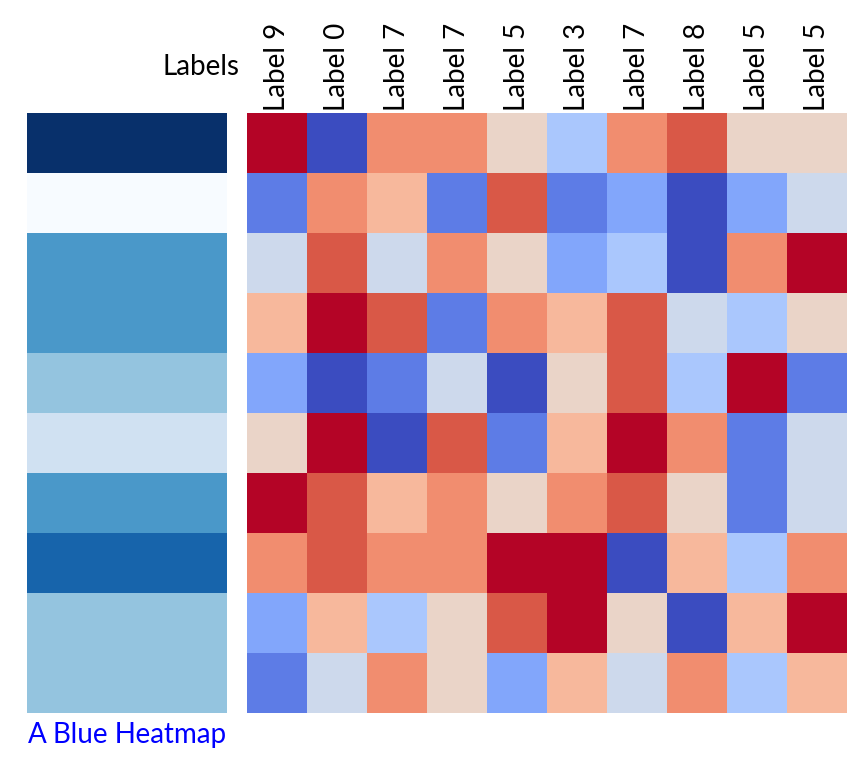
Label plotter#
Marsilea provides a simple way to add a label any side plots.
In most cases, supplying the label parameter is enough to add a label to the plot.
You can also control the location of the label using the label_loc parameter.
The label can be customized using the label_props parameter.
Define some data
h = ma.Heatmap(data, width=3, height=3)

label_blue = Colors(
    data[0],
    cmap="Blues",
    label="A Blue Heatmap",
    label_loc="bottom",
    label_props={"color": "blue", "rotation": 0},
)
label_labels = Labels([f"Label {i}" for i in data[0]], label="Labels", label_loc="left")

h.add_left(label_blue, pad=0.1)
h.add_top(label_labels)
h.render()
Total running time of the script: (0 minutes 0.317 seconds)