Note
Go to the end to download the full example code.
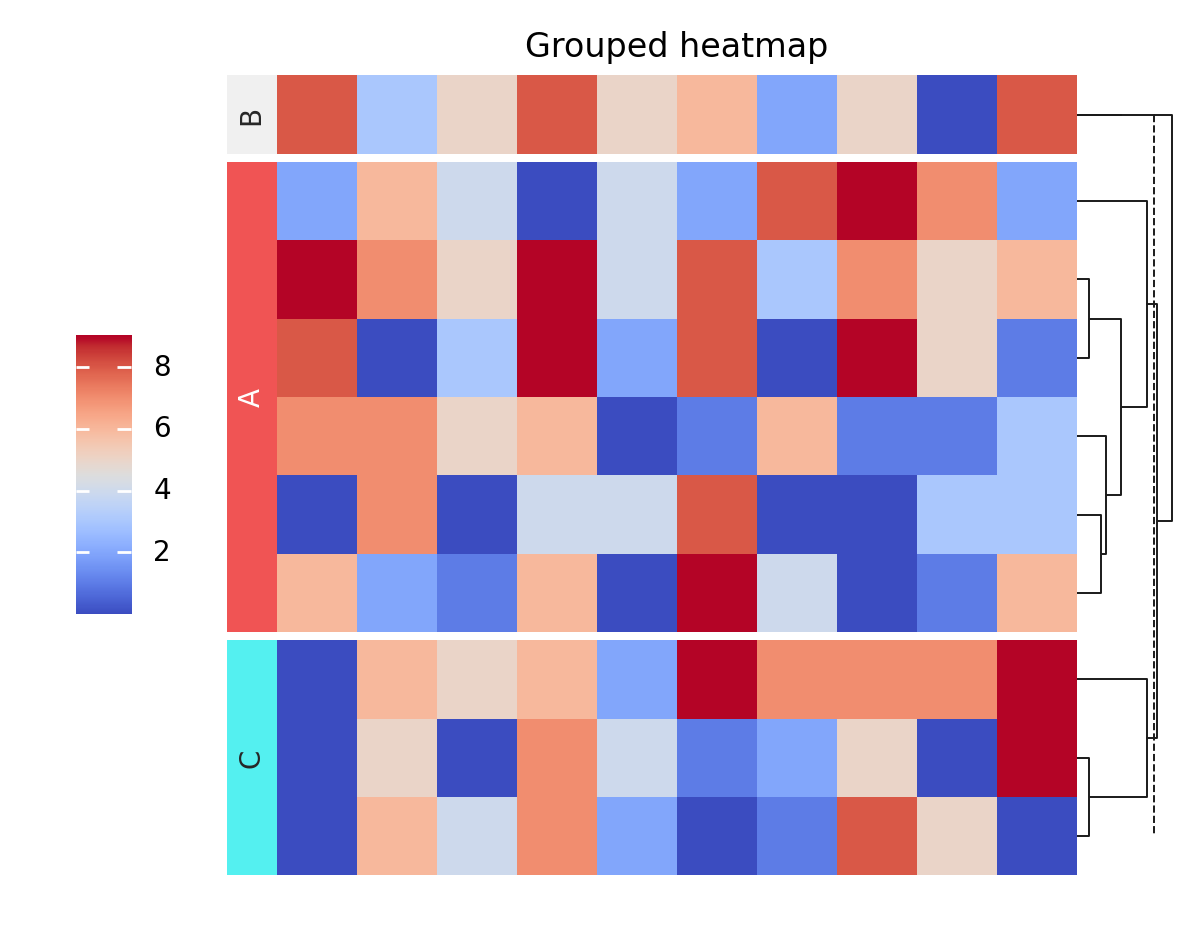
Grouped heatmap#
import numpy as np
import marsilea as ma

data = np.random.randint(0, 10, (10, 10))
groups = np.random.choice(["A", "B", "C"], 10)
h = ma.Heatmap(data)
h.add_dendrogram("right")
h.group_rows(groups, order=["A", "B", "C"])
h.add_left(
    ma.plotter.Chunk(["A", "B", "C"], fill_colors=["#F05454", "#F0F0F0", "#54F0F0"])
)
h.add_legends("left")
h.add_title("Grouped heatmap")
h.render()
Total running time of the script: (0 minutes 0.690 seconds)