UpSet Plot#
UpSet Plot offers a powerful alternative to Venn diagrams when dealing with multiple sets, making it easier to visualize complex relationships among sets.
Note
Set A collection of unique objects.
Item An object in a set.
Cardinality The number of items in the subset.
Degree The number of sets that intersect with each other.
Data Input#
There are three ways to represents multiple sets:
A list of sets and their respective items.
A list of items and the sets they belong to.
A sets × items table, use 0 or 1 to indicate an item’s presence in a set.
The UpsetData simplifies working with set data,
offering useful methods for querying information about various sets.
To demonstrate, we’ll use the Top 1000 movies from the IMDB database.
>>> from marsilea import load_data
>>> from marsilea.upset import UpsetData
>>> imdb = load_data('imdb')
>>> imdb = imdb.drop_duplicates('Title')
>>> upset_data = UpsetData.from_memberships(imdb.Genre.str.split(','))
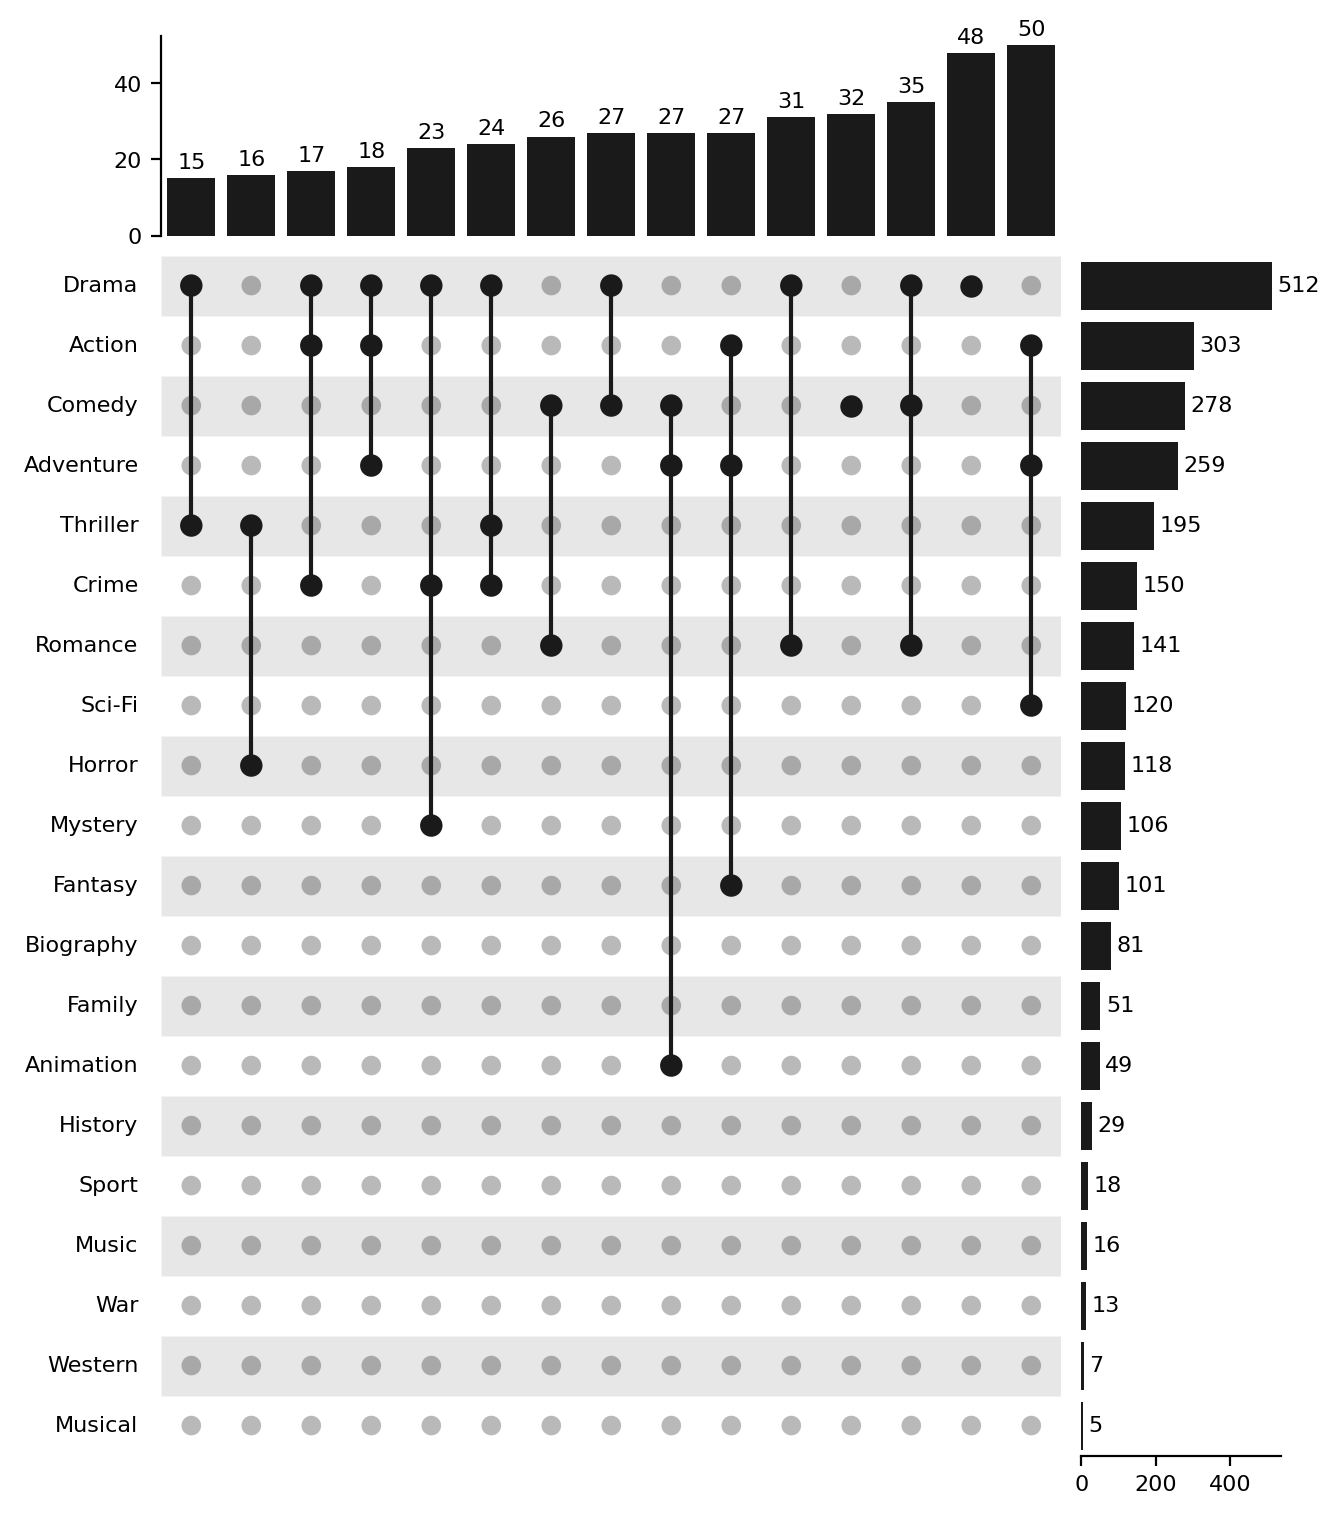
Creating an UpSet Plot#
The Upset in Marsilea can be used to
create UpSet plot from UpsetData.
Like other visualizations in Marsilea,
simply call the render() method to bring your plot to life.
>>> from marsilea.upset import Upset
>>> us = Upset(upset_data, min_cardinality=15)
>>> us.render()
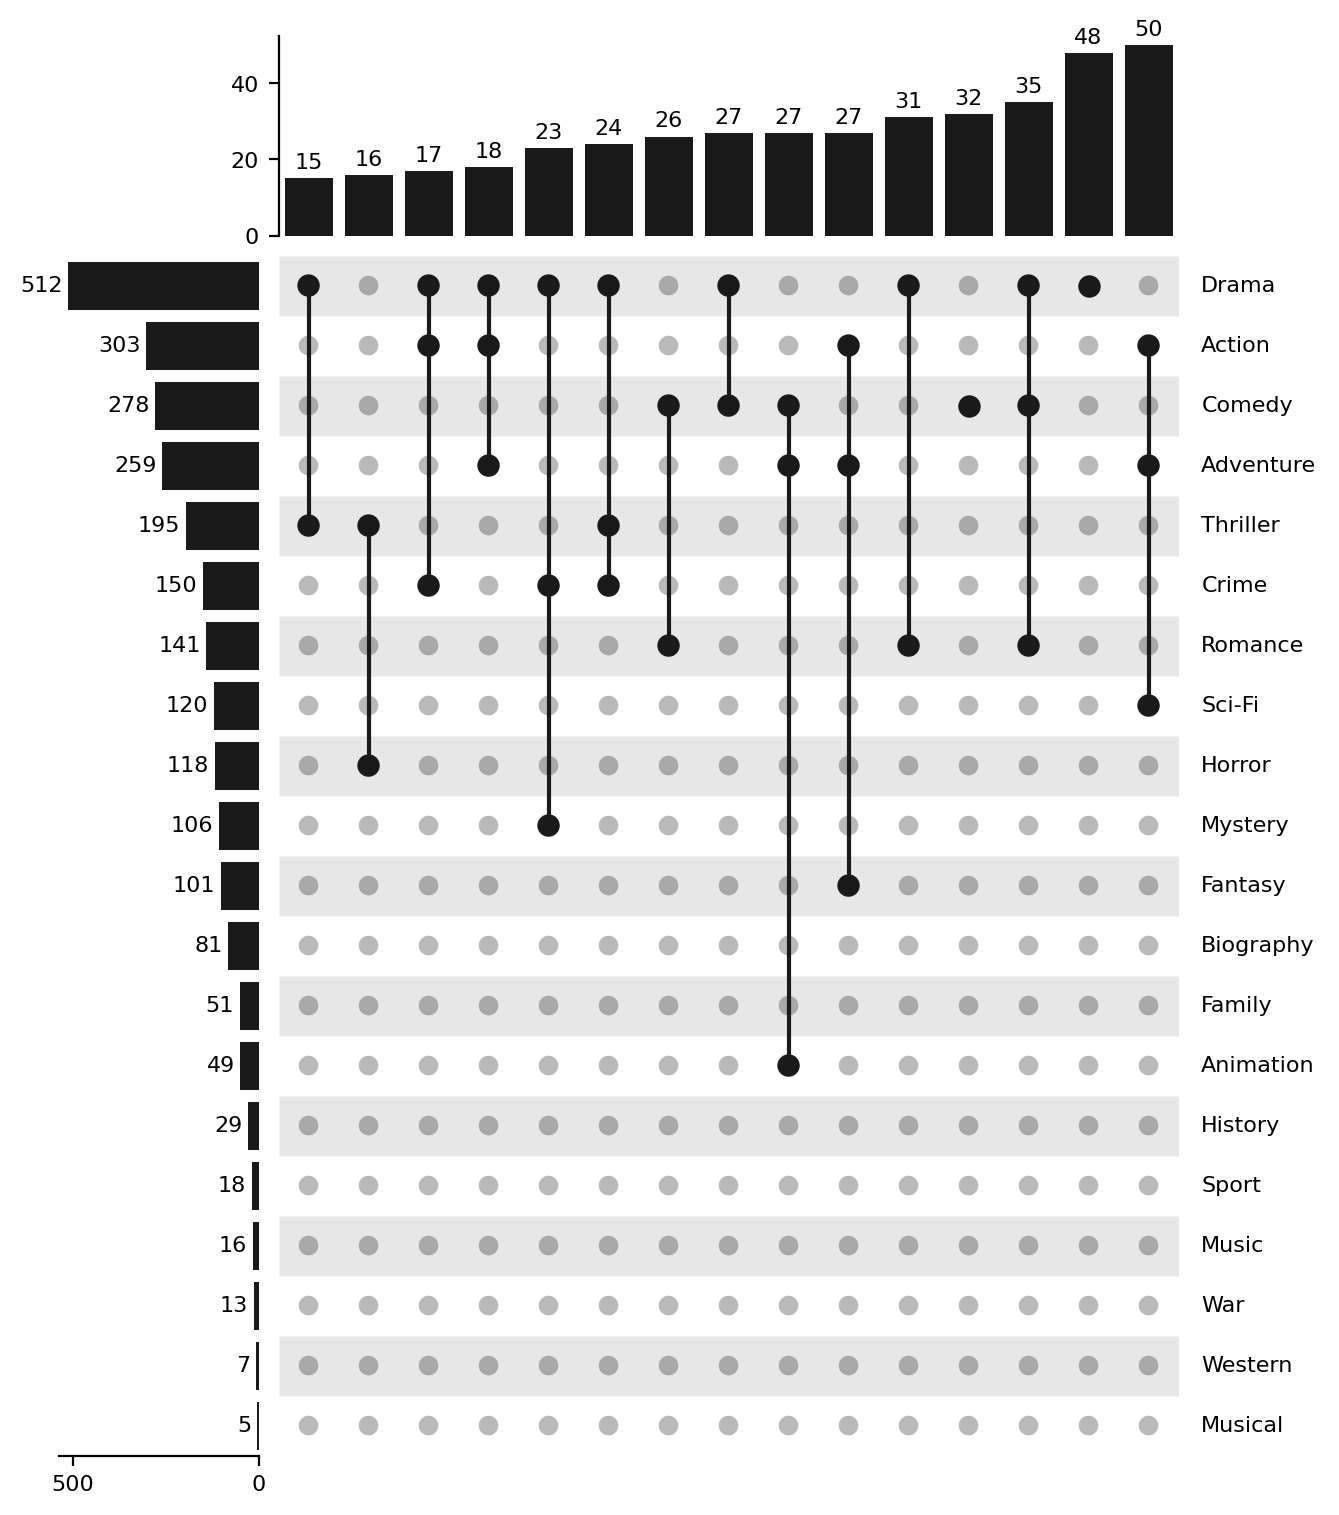
You may change the positions of components:
>>> us = Upset(upset_data, min_cardinality=15, add_labels="left",
...            add_sets_size="right")
>>> us.render()
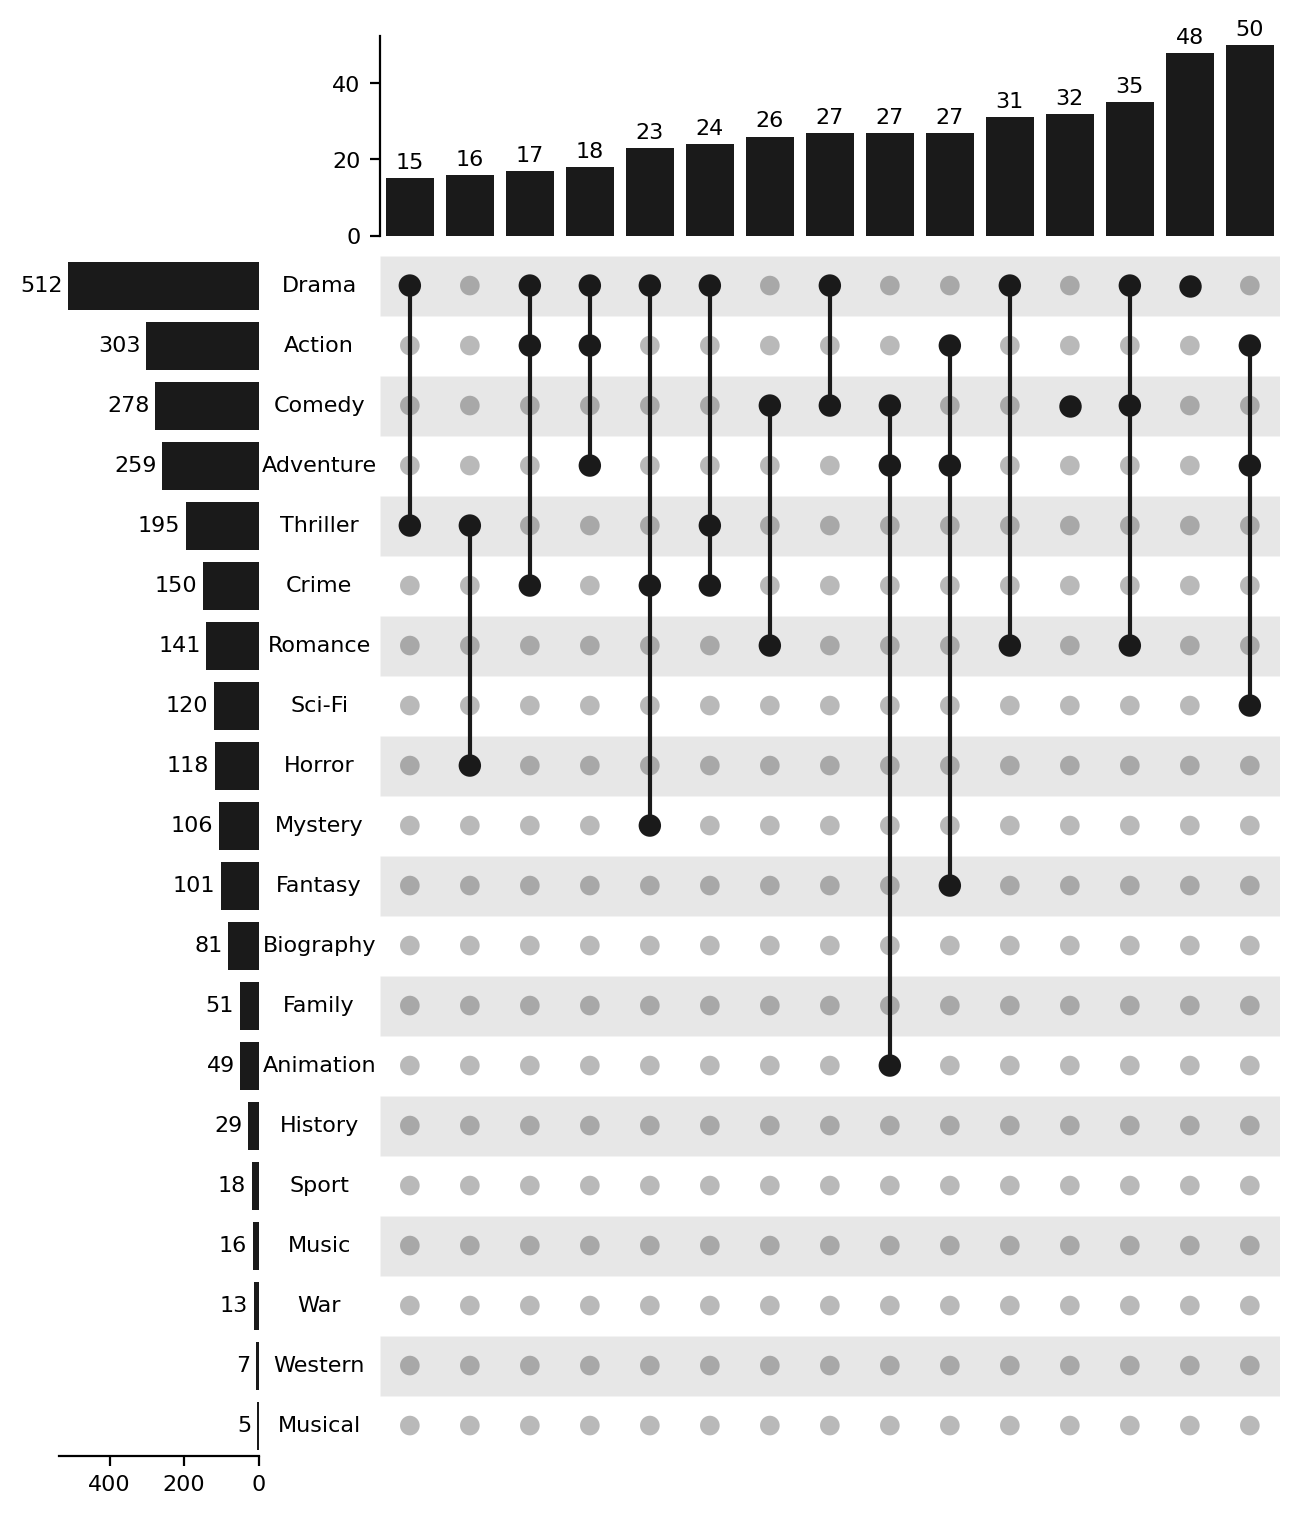
For finer control, you can add components manually:
>>> us = Upset(upset_data, min_cardinality=15, add_labels=False,
...            add_sets_size=False)
>>> us.add_sets_label(side="left", pad=0, align="center")
>>> us.add_sets_size(side="left", pad=0)
>>> us.render()
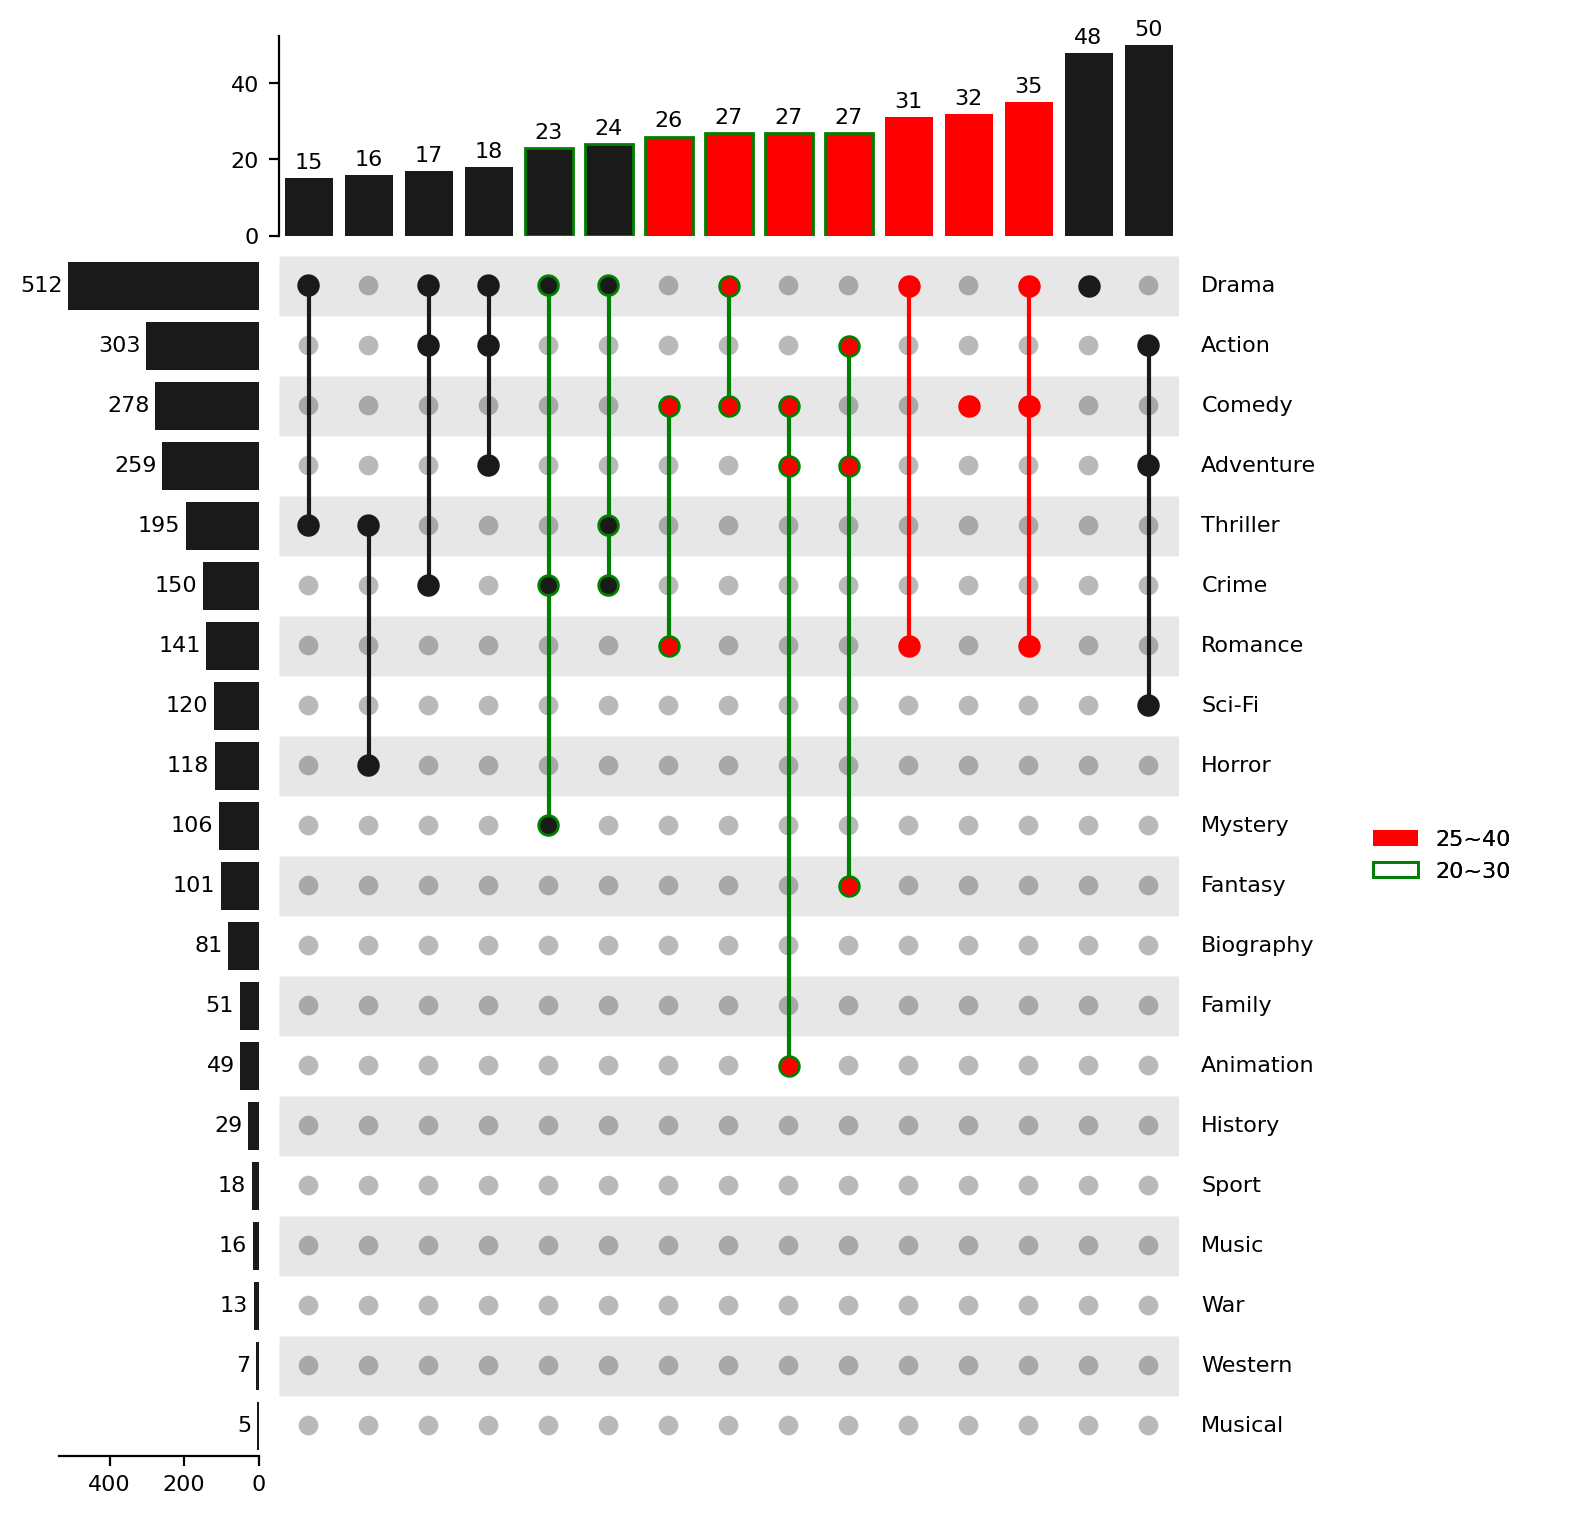
Highlighting specific sets#
To emphasize specific sets, use the
highlight_subsets() method.
>>> us = Upset(upset_data, min_cardinality=15)
>>> us.highlight_subsets(facecolor='red', label="25~40",
...                      min_cardinality=25, max_cardinality=40)
>>> us.highlight_subsets(edgecolor='green', label="20~30",
...                      min_cardinality=20, max_cardinality=30)
>>> us.add_legends()
>>> us.render()
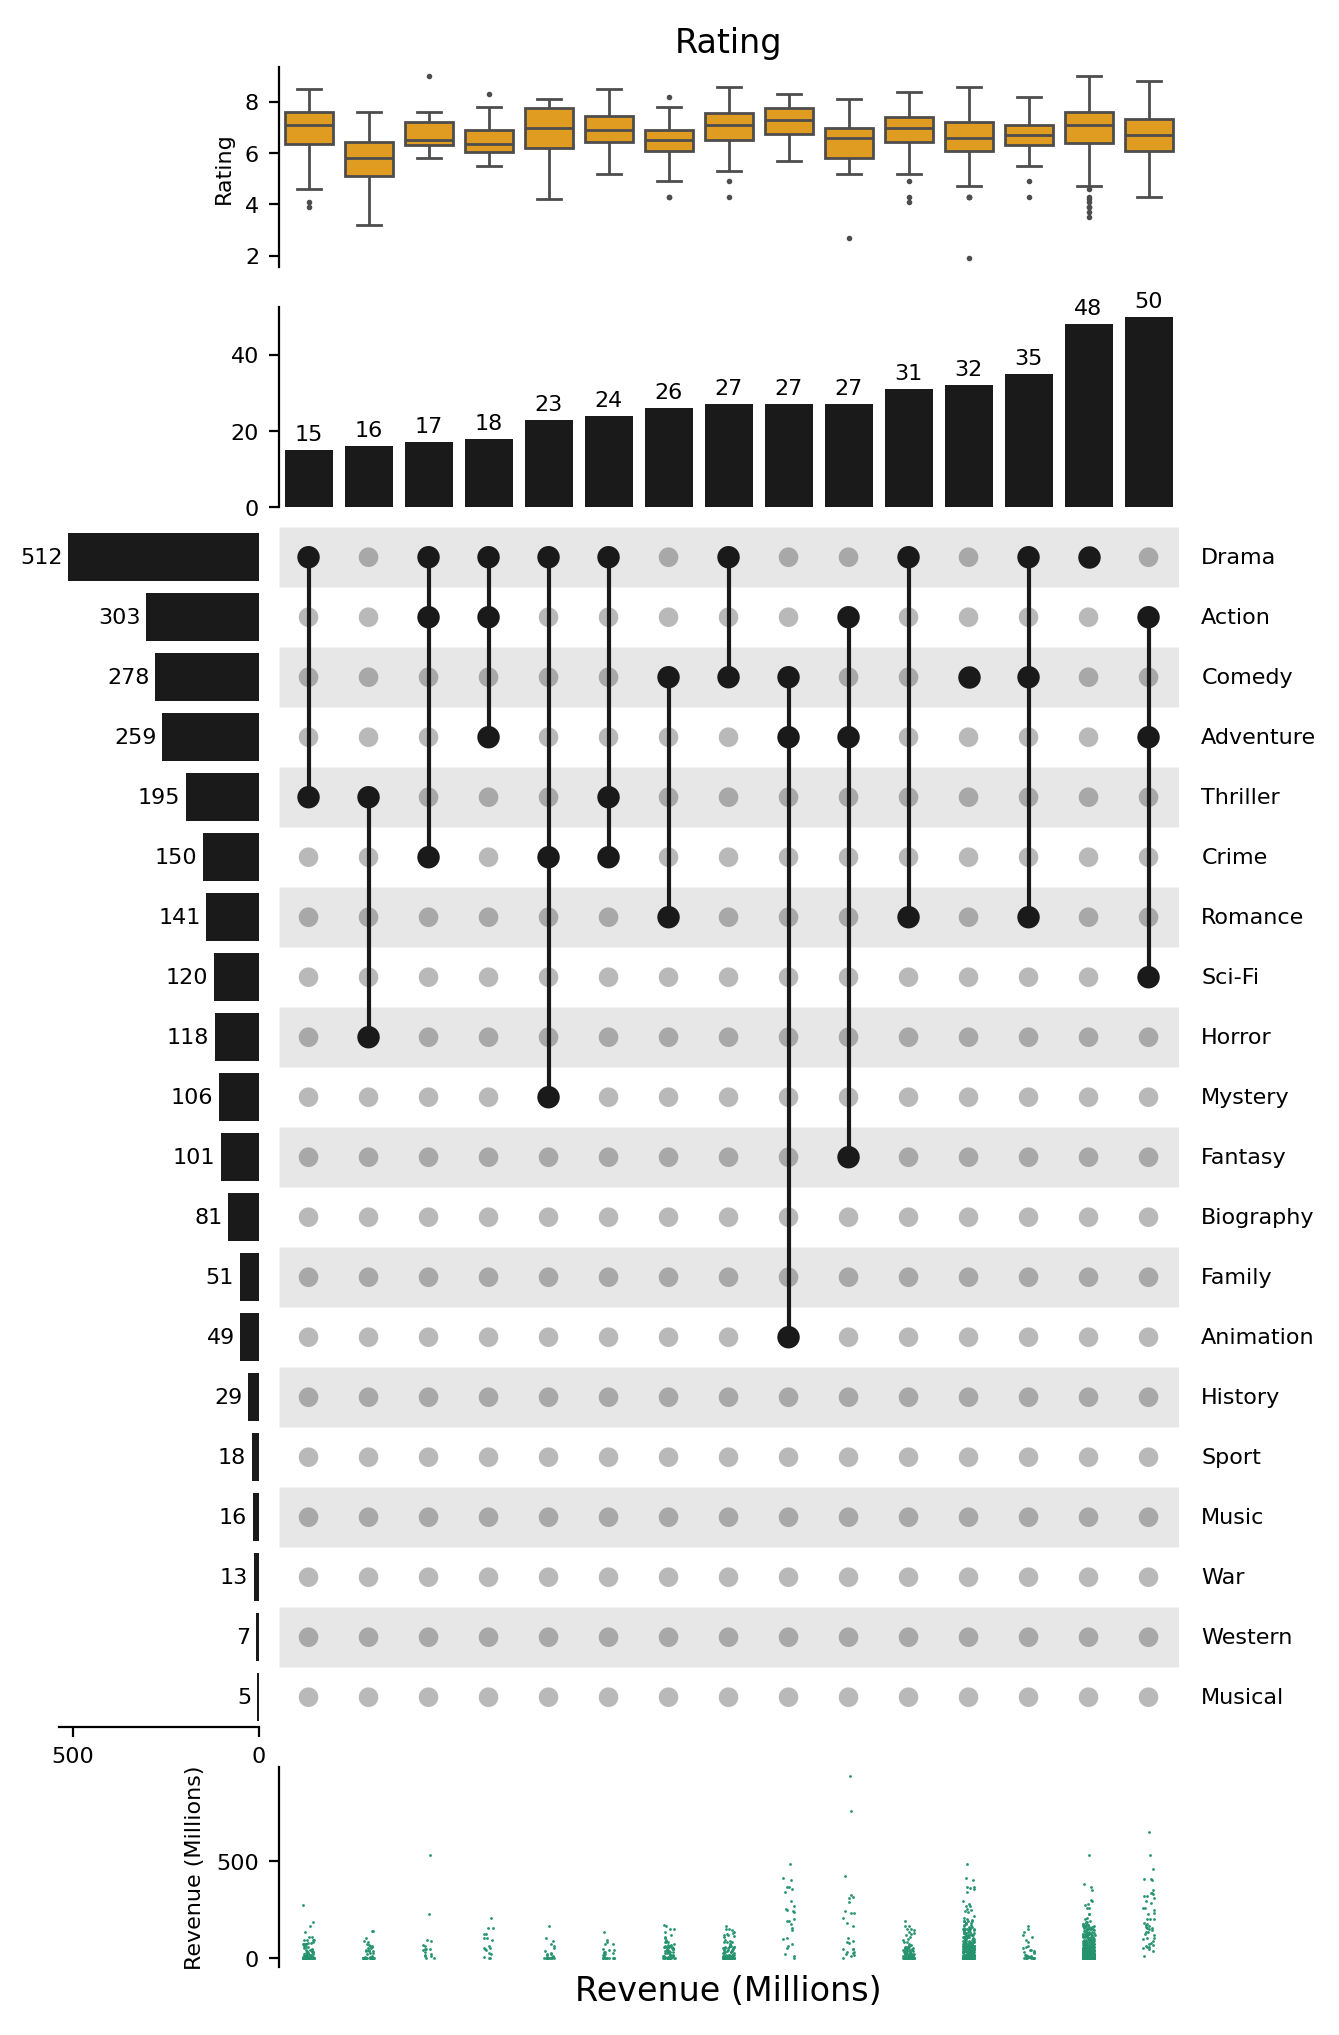
Visualizing Set and Item Attributes#
UpSet plots not only showcase intersections but also display the distribution of different attributes.
>>> items_attrs = imdb[['Title', 'Rating', 'Revenue (Millions)']].set_index('Title')
>>> imdb_data = UpsetData.from_memberships(imdb.Genre.str.split(','),
...                                        items_names=imdb['Title'], items_attrs=items_attrs)
>>> us = Upset(imdb_data, min_cardinality=15)
>>> us.add_items_attr("top", "Rating", "box", pad=.2, plot_kws=dict(color="orange", linewidth=1, fliersize=1))
>>> us.add_title(top="Rating")
>>> us.add_items_attr("bottom", "Revenue (Millions)", "strip", pad=.2, plot_kws=dict(size=1, color="#24936E"))
>>> us.add_title(bottom="Revenue (Millions)")
>>> us.render()