marsilea.plotter.SizedMesh#
- class SizedMesh(size, color=None, cmap=None, norm=None, vmin=None, vmax=None, alpha=None, center=None, sizes=(1, 200), size_norm=None, edgecolor=None, linewidth=1, frameon=True, grid=False, grid_color='.8', grid_linewidth=1, palette=None, marker='o', label=None, label_loc=None, label_props=None, legend=True, size_legend_kws=None, color_legend_kws=None, **kwargs)#
Bases:
MeshBaseMesh for sized elements
Note
If encode color as categorical data, palette must be used to assign color for each category.
- Parameters:
- size2d array
Control the radius of circles, must be numeric
- color: color-like or 2d array
The color of circles, could be numeric / categorical matrix If using one color name, all circles will have the same color.
- cmapstr or
matplotlib.colors.Colormap The colormap used to map the value to the color
- norm
matplotlib.colors.Normalize A Normalize instance to map data
- vmin, vmaxnumber, optional
Value to determine the value mapping behavior
- centernumber, optional
The value to center on colormap, notice that this is different from seaborn; If set, a
matplotlib.colors.TwoSlopeNormwill be used to center the colormap.- alphafloat
The transparency value
- sizestuple of float
The range of the size of elements
- size_norm
matplotlib.colors.Normalize A Normalize instance to map size
- edgecolorcolor
The border color of each elements
- linewidthfloat
The width of the border of each elements
- frameonbool
Whether to draw a frame
- gridbool
Whether to draw grid
- grid_colorcolor
The color of grid
- grid_linewidthfloat
The width of grid line
- palettedict
Use to map color if input categorical data
- markerstr
- labelstr
The label of the plot, only show if added to the side plot
- label_loc{‘top’, ‘bottom’, ‘left’, ‘right’}
Where to add the label
- label_propsdict
- legendbool, default: True
Whether to add a legend
- size_legend_kwsdict
Control the size legend, See
legendkit.size_legend- color_legend_kwsdict
Control the color legend, See
legendkit.colorart- kwargsdict
Pass to
matplotlib.axes.Axes.scatter()
See also
Examples
>>> import marsilea as ma
>>> from marsilea.plotter import SizedMesh
>>> _, ax = plt.subplots(figsize=(5, .5))
>>> size, color = np.random.rand(1, 10), np.random.rand(1, 10)
>>> SizedMesh(size, color).render(ax)

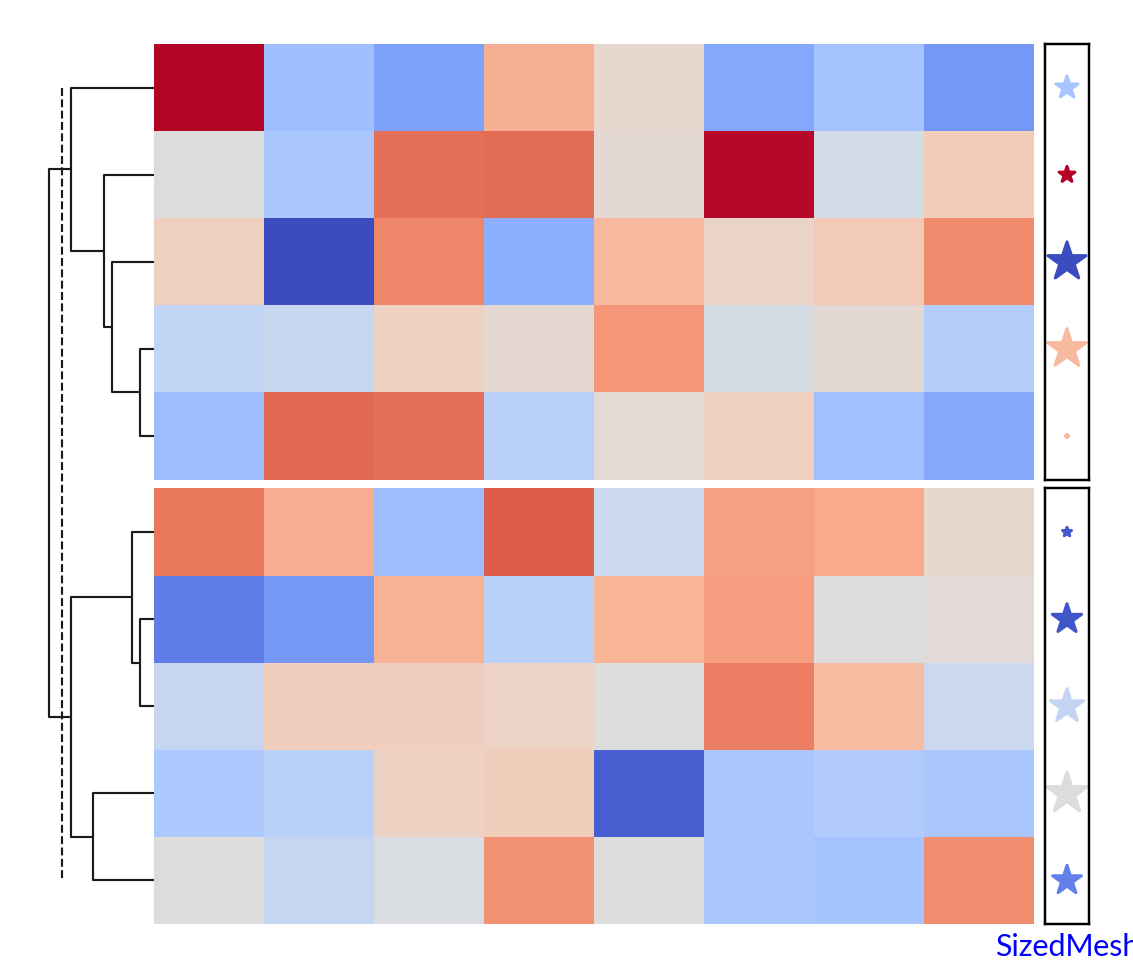
>>> h = ma.Heatmap(np.random.randn(10, 8))
>>> h.hsplit(cut=[5])
>>> h.add_dendrogram("left")
>>> mesh = SizedMesh(size, color, marker="*", label="SizedMesh")
>>> h.add_right(mesh, size=.2, pad=.05)
>>> h.render()
- update_main_canvas_size()#