Heatmap#
Creation of annotated heatmap in Marsilea is very easy.
Creating a basic heatmap#
Marsilea has APIs to directly create different heatmap.
Matrix Heatmap:
HeatmapMatrix Heatmap with sized elements:
SizedHeatmapCategorical Heatmap:
CatHeatmapLayered Heatmap
Layers
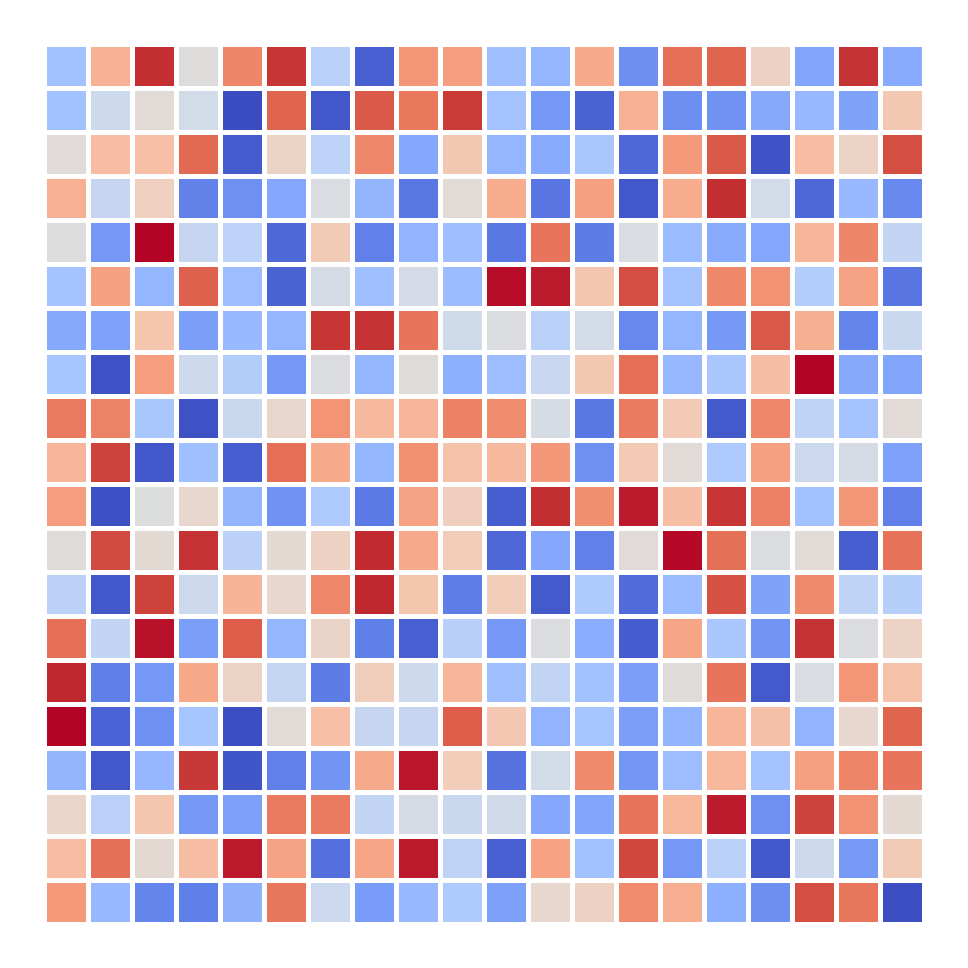
Matrix Heatmap#
>>> import marsilea as ma
>>> data = np.random.rand(20, 20)
>>> h = ma.Heatmap(data, linewidth=1)
>>> h.render()
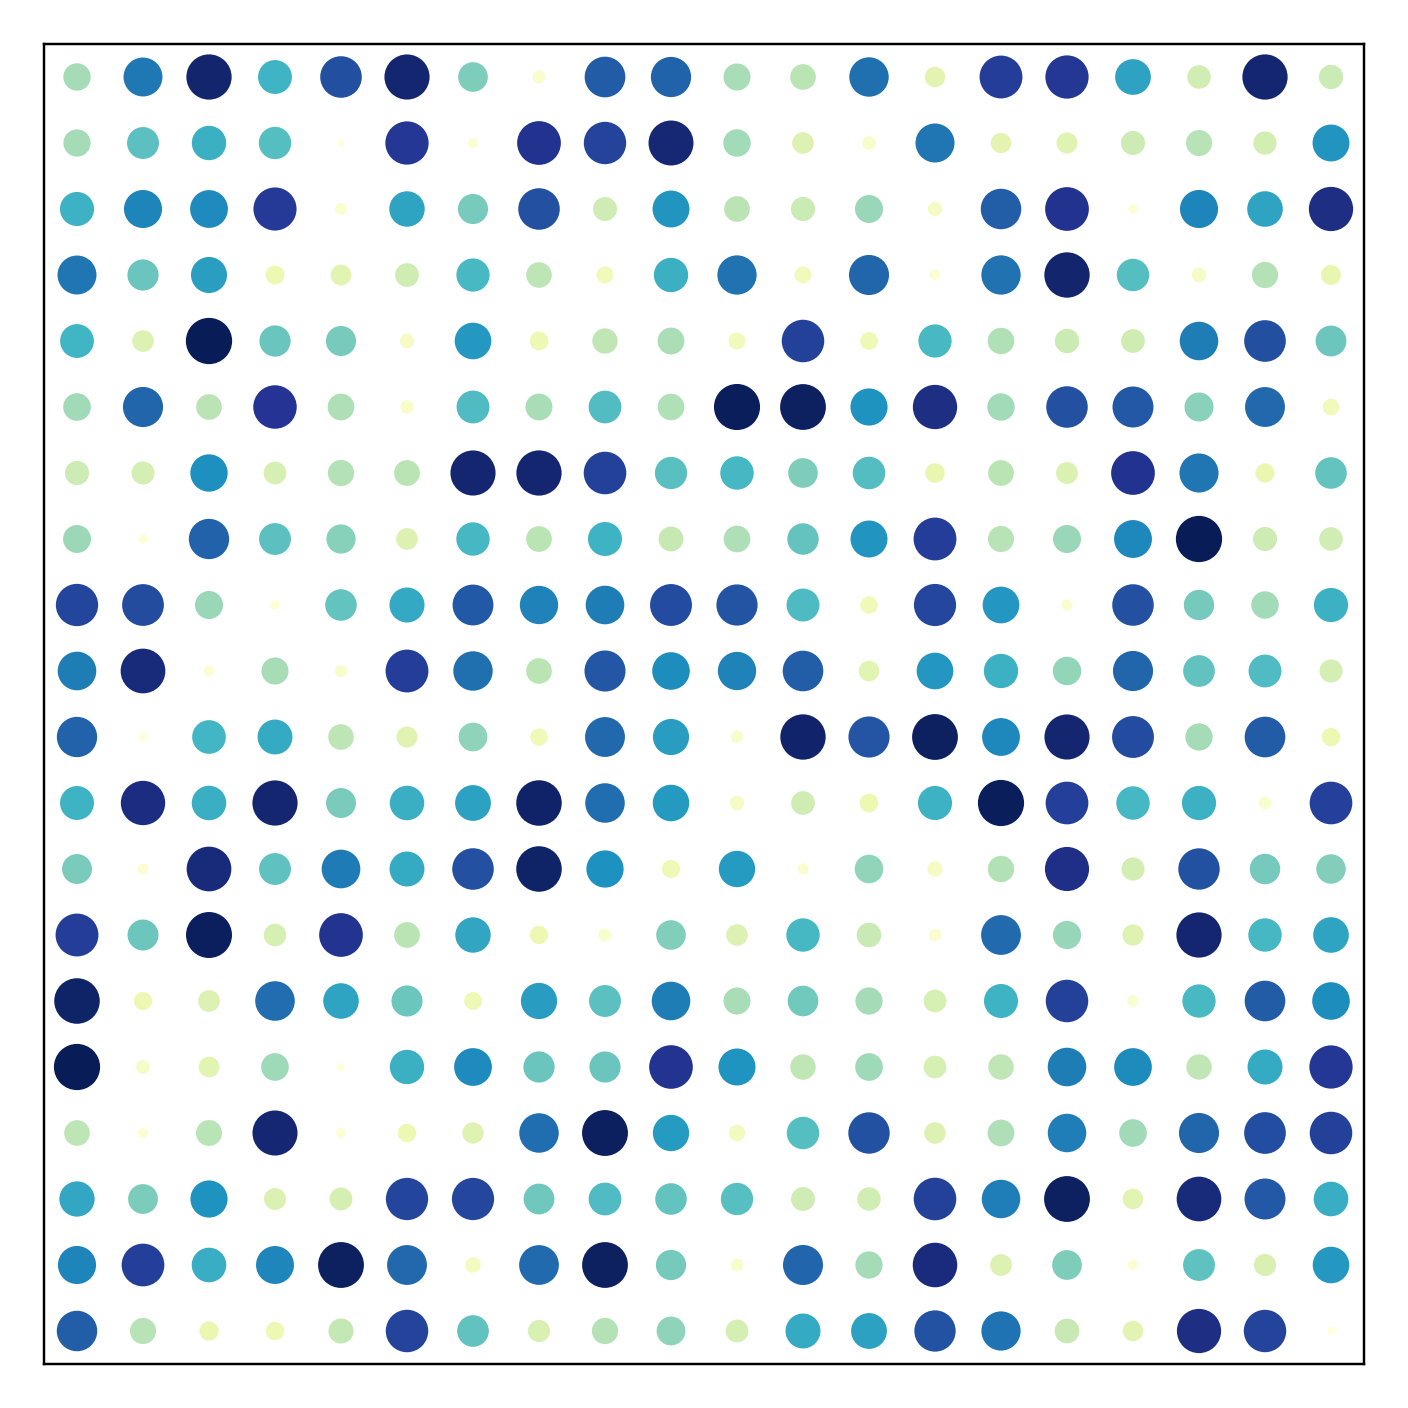
Matrix Heatmap with sized elements#
>>> s = ma.SizedHeatmap(size=data, color=data, cmap="YlGnBu")
>>> s.render()
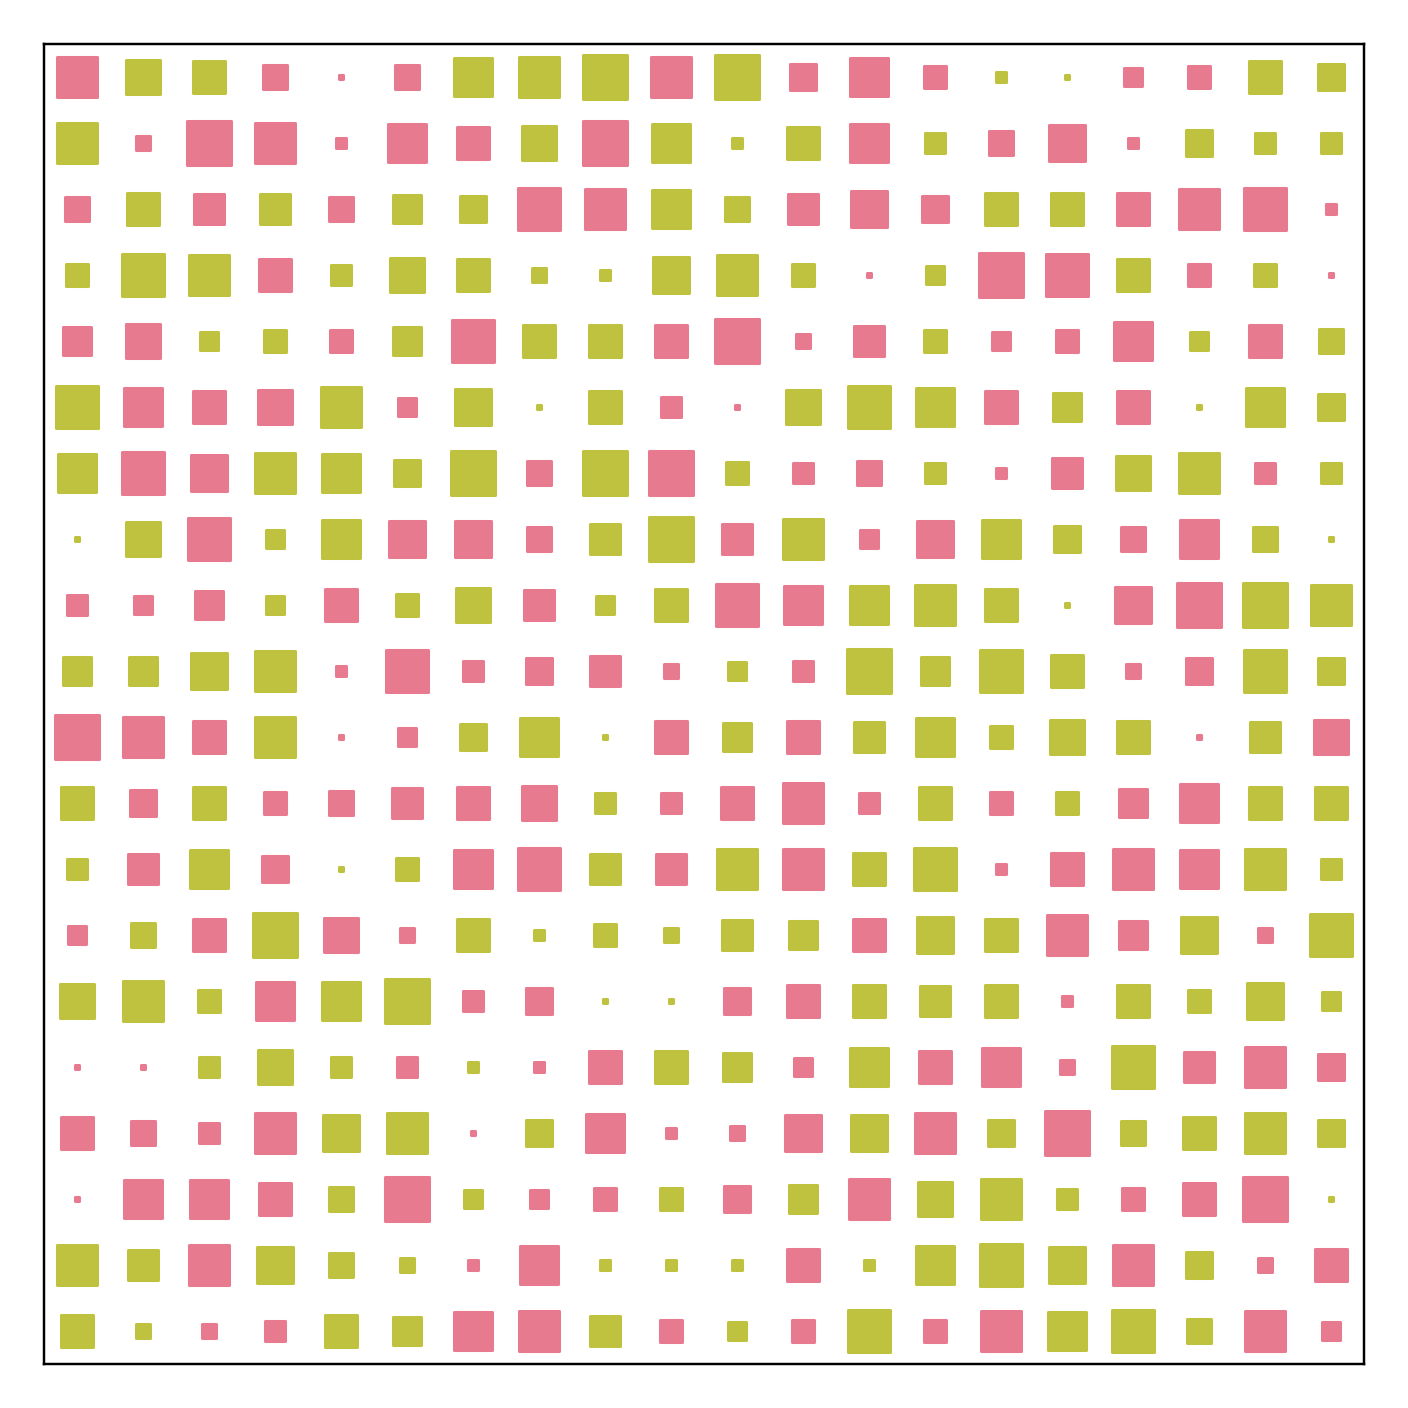
Create Hinton diagram. If your colors are categorical, you can easily assign colors to each category.
>>> matrix = np.random.randint(-10, 10, (20, 20))
>>> size = np.random.randint(-10, 10, (20, 20))
>>> color = matrix > 0
>>> s = ma.SizedHeatmap(size=size, color=color, marker="s",
...                     palette={True: "#E87A90", False: "#BEC23F"})
>>> s.render()
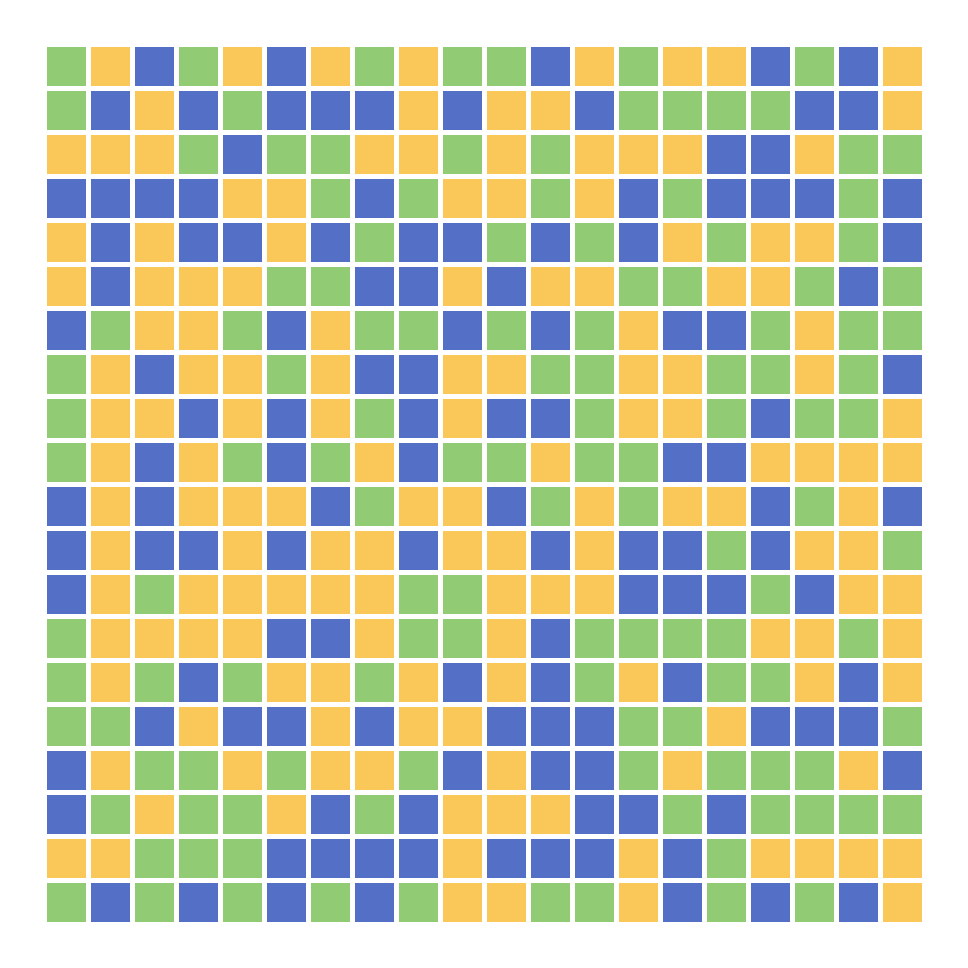
Categorical Heatmap#
>>> data = np.random.choice(["A", "B", "C"], size=(20, 20))
>>> c = ma.CatHeatmap(data, linewidth=1)
>>> c.render()
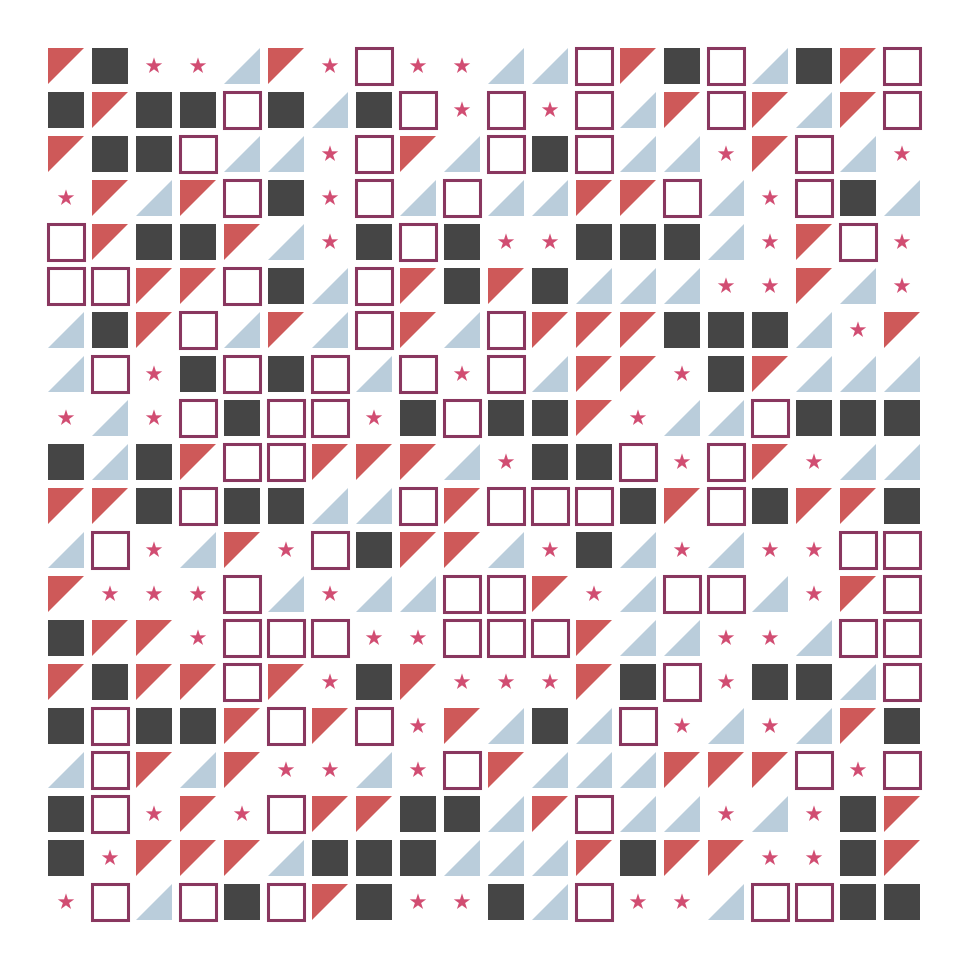
Layered Heatmap#
Layered Heatmap is a special type of heatmap that allows you to render customized elements. Marsilea provides a set of predefined elements. You can also create your own.
You can render the heatmap with one layer or multiple layers. The following example shows how to create a heatmap with one layer but different elements.
>>> from marsilea.layers import Rect, FrameRect, RightTri, Marker
>>> mapper = {0: Rect(color="#454545"), 1: Marker("*", color="#D14D72"),
...           2: FrameRect(color="#89375F"), 3: RightTri(color="#CE5959"),
...           4: RightTri(color="#BACDDB", right_angle="upper right")}
>>> data = np.random.choice([0, 1, 2, 3, 4], (20, 20))
>>> l = ma.Layers(data=data, pieces=mapper, shrink=(.8, .8))
>>> l.render()
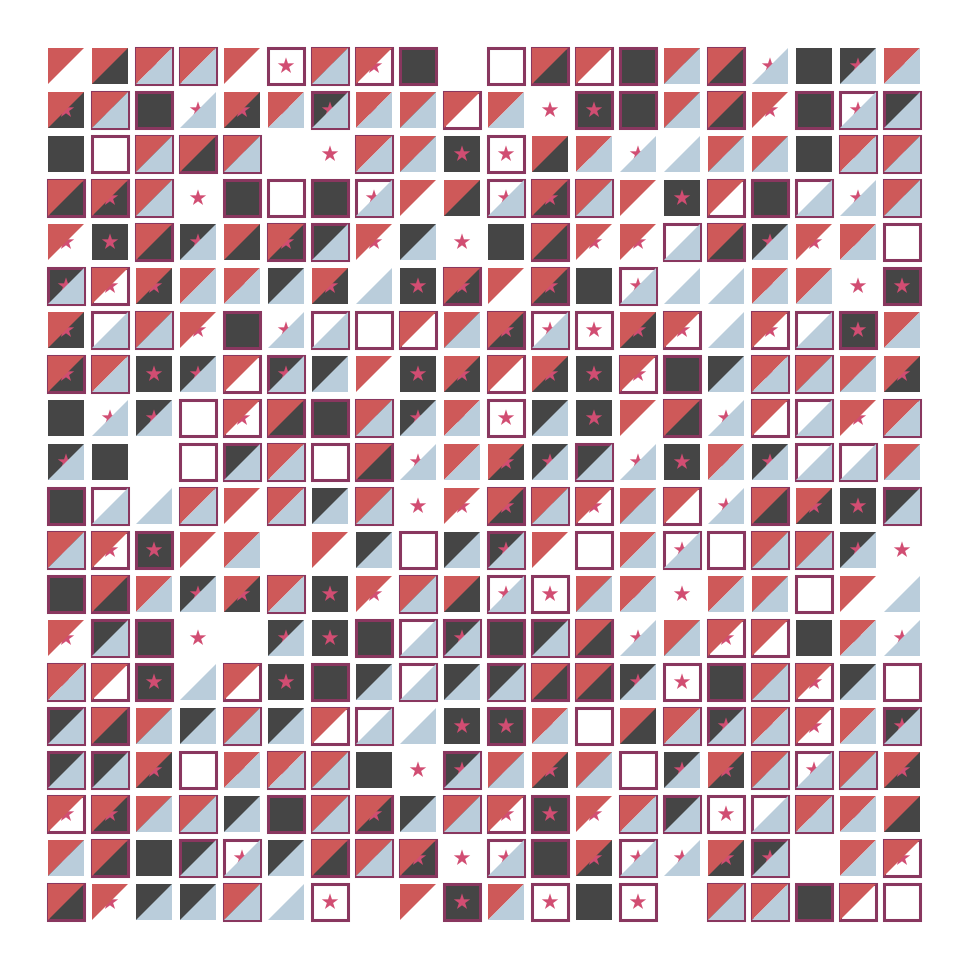
But you can also create a heatmap with multiple layers, each layer will render one element. The following example shows how to create a heatmap with multiple layers.
>>> layers = [np.random.choice([0, 1], (20, 20)) for _ in range(5)]
>>> pieces = mapper.values()
>>> l = ma.Layers(layers=layers, pieces=pieces, shrink=(.8, .8))
>>> l.render()
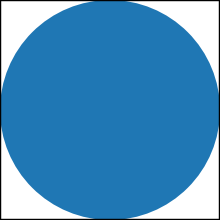
The following example shows how to create your own element.
>>> from marsilea.layers import Piece, preview
>>> from matplotlib.patches import Circle
>>> class MyCircle(Piece):
...     def __init__(self, color="C0", label=None):
...         self.color = color
...         self.label = label
...
...     def draw(self, x, y, w, h, ax):
...         xy = (x + .5, y + .5)
...         r = min(w, h) / 2
...         return Circle(xy, radius=r, lw=1, fc=self.color)
...
>>> preview(MyCircle())
>>> data = np.random.choice([0, 1], (10, 10))
>>> l = ma.Layers(layers=[data], pieces=[MyCircle()], shrink=(.8, .8))
>>> l.render()

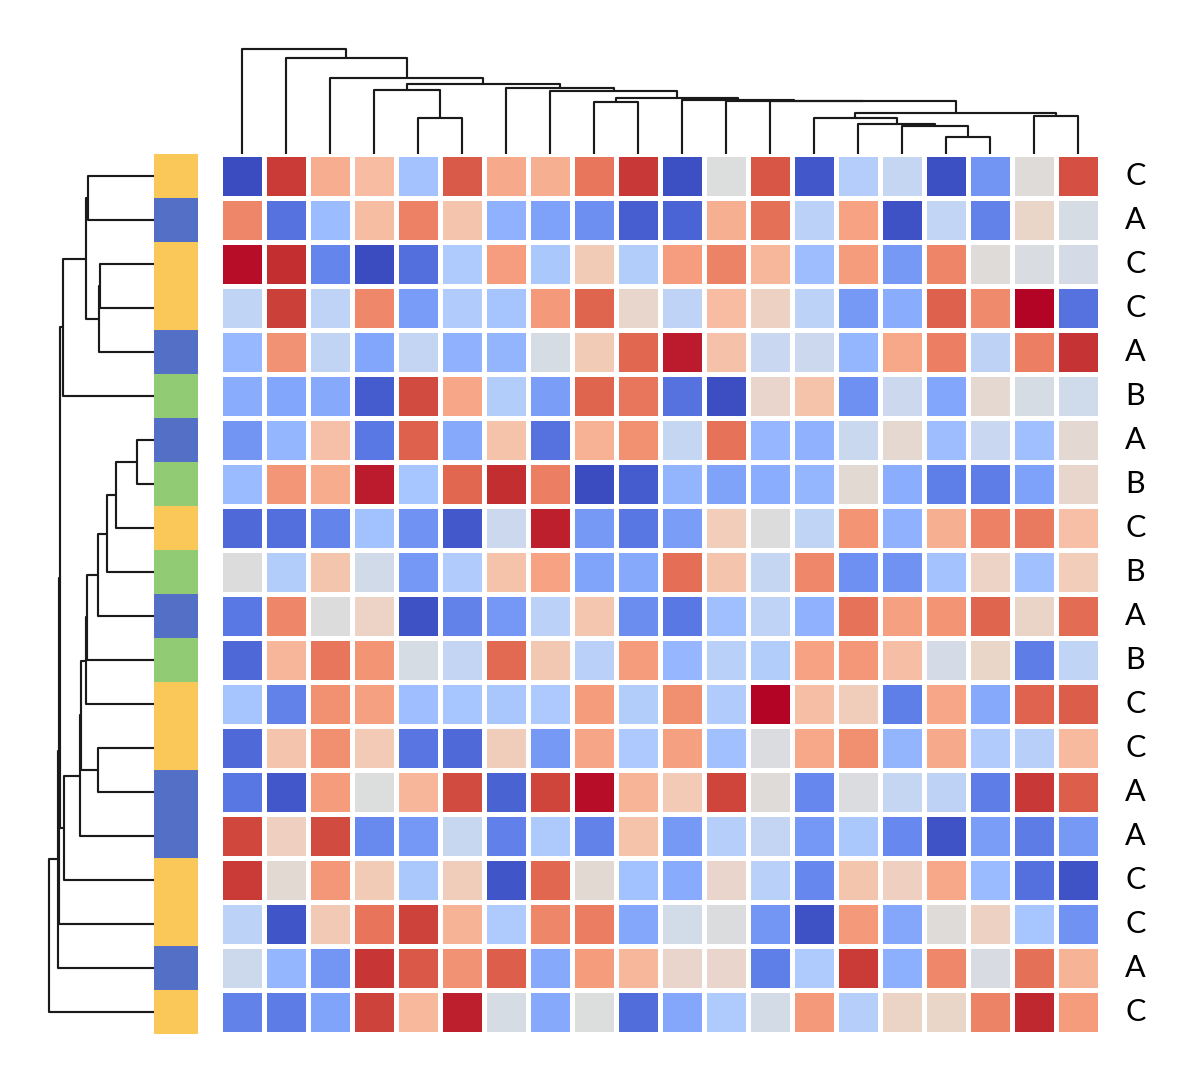
Additional components#
Typically, you’ll want to include components such as labels, dendrograms, and other plots when creating a heatmap. Marsilea makes it easy to add these components. Let’s create a clustermap like in Seaborn.
>>> import marsilea.plotter as mp
>>> data = np.random.rand(20, 20)
>>> cat = np.random.choice(["A", "B", "C"], 20)
>>> h = ma.Heatmap(data, linewidth=1)
>>> h.add_left(mp.Colors(cat), size=.2, pad=.1)
>>> h.add_dendrogram("left")
>>> h.add_dendrogram("top")
>>> h.add_right(mp.Labels(cat), pad=.1)
>>> h.render()
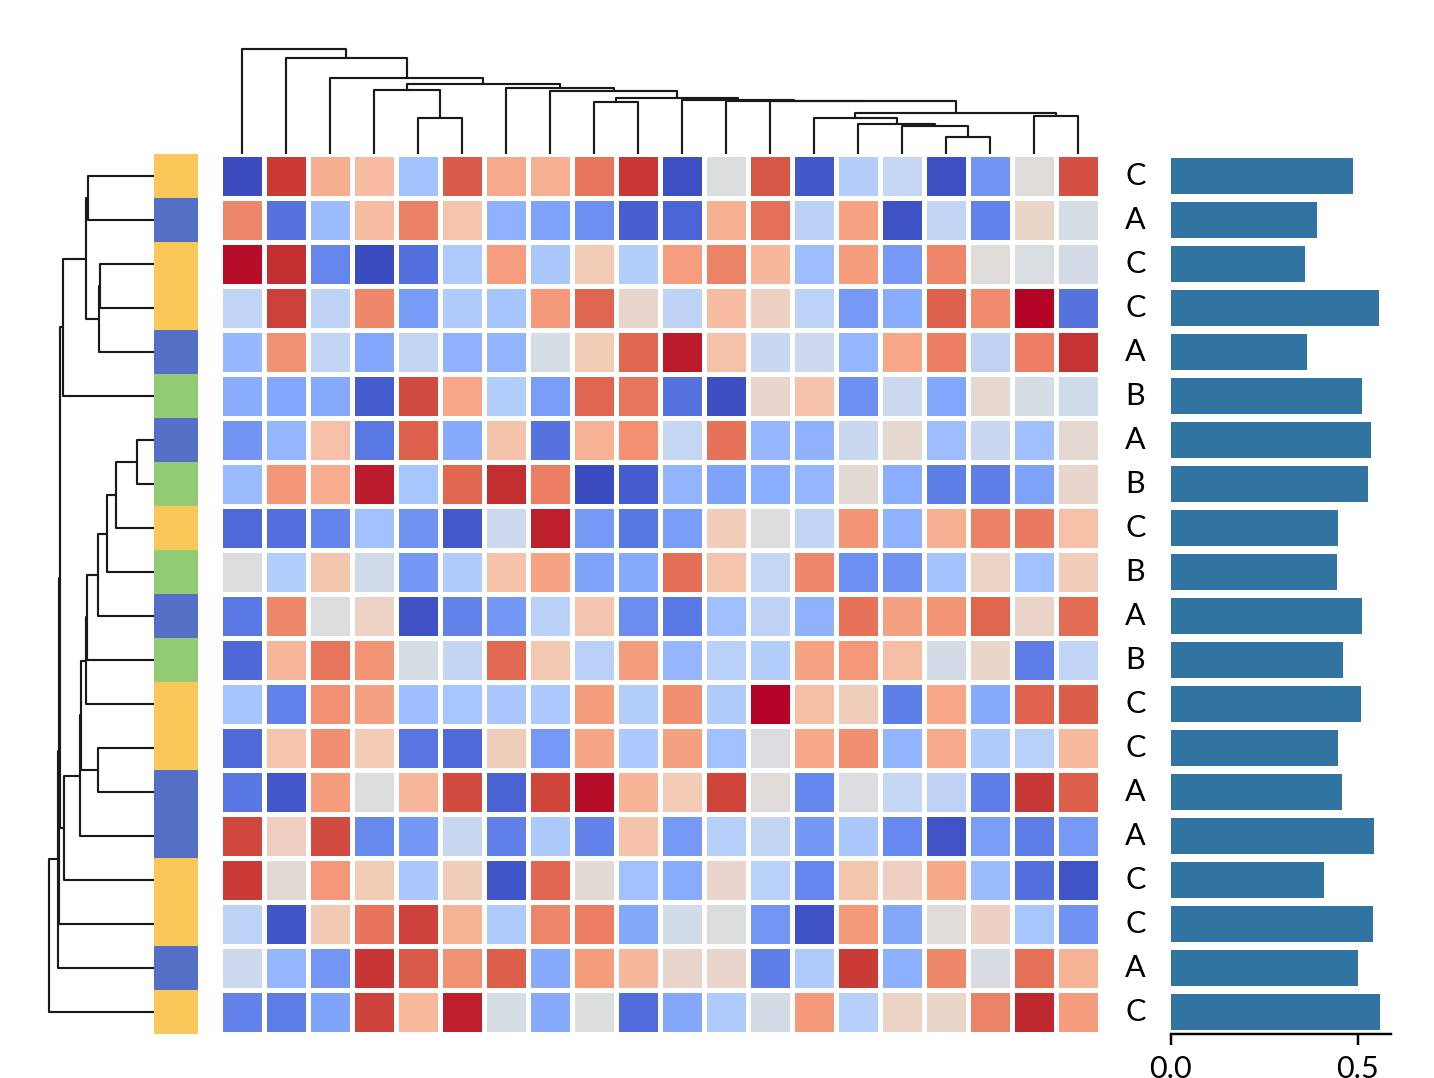
We could easily include a bar plot to the heatmap.
>>> h.add_right(mp.Bar(data.mean(axis=0)), pad=.1)
>>> h.render()
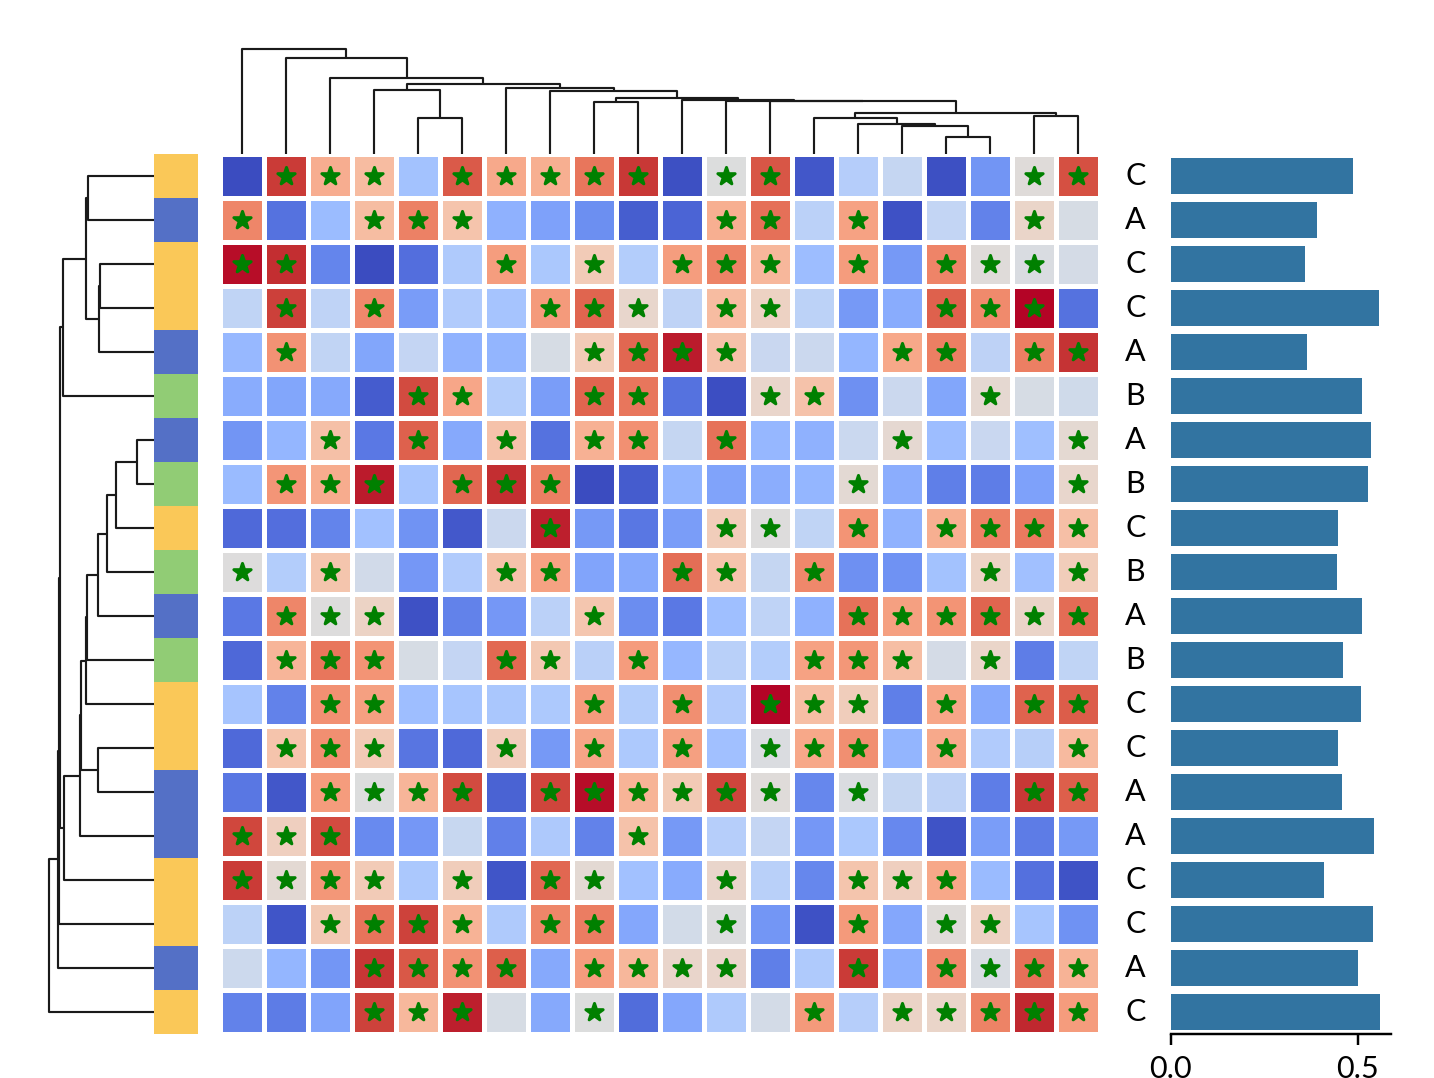
It’s possible to overlay another layer on top of the heatmap.
>>> mark = data > data.mean()
>>> h.add_layer(mp.MarkerMesh(mark, color="g", label="Above Mean"))
>>> h.render()
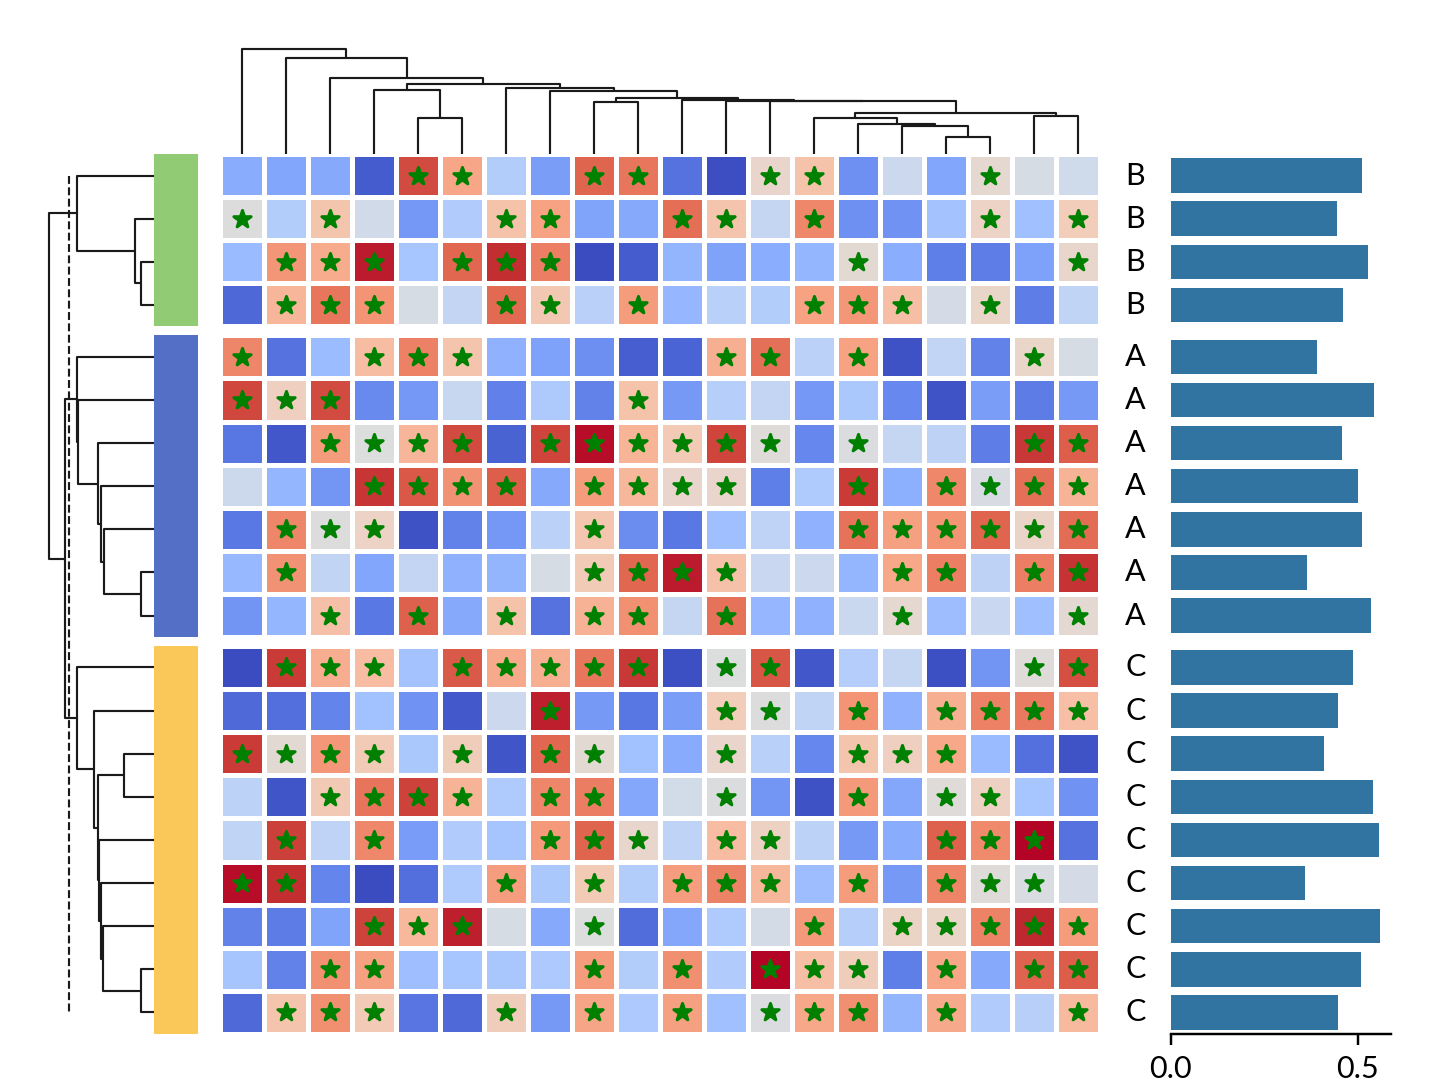
Grouping the heatmap#
You can easily split the heatmap into multiple groups.
>>> h.hsplit(labels=cat, order=["A", "B", "C"])
>>> h.render()
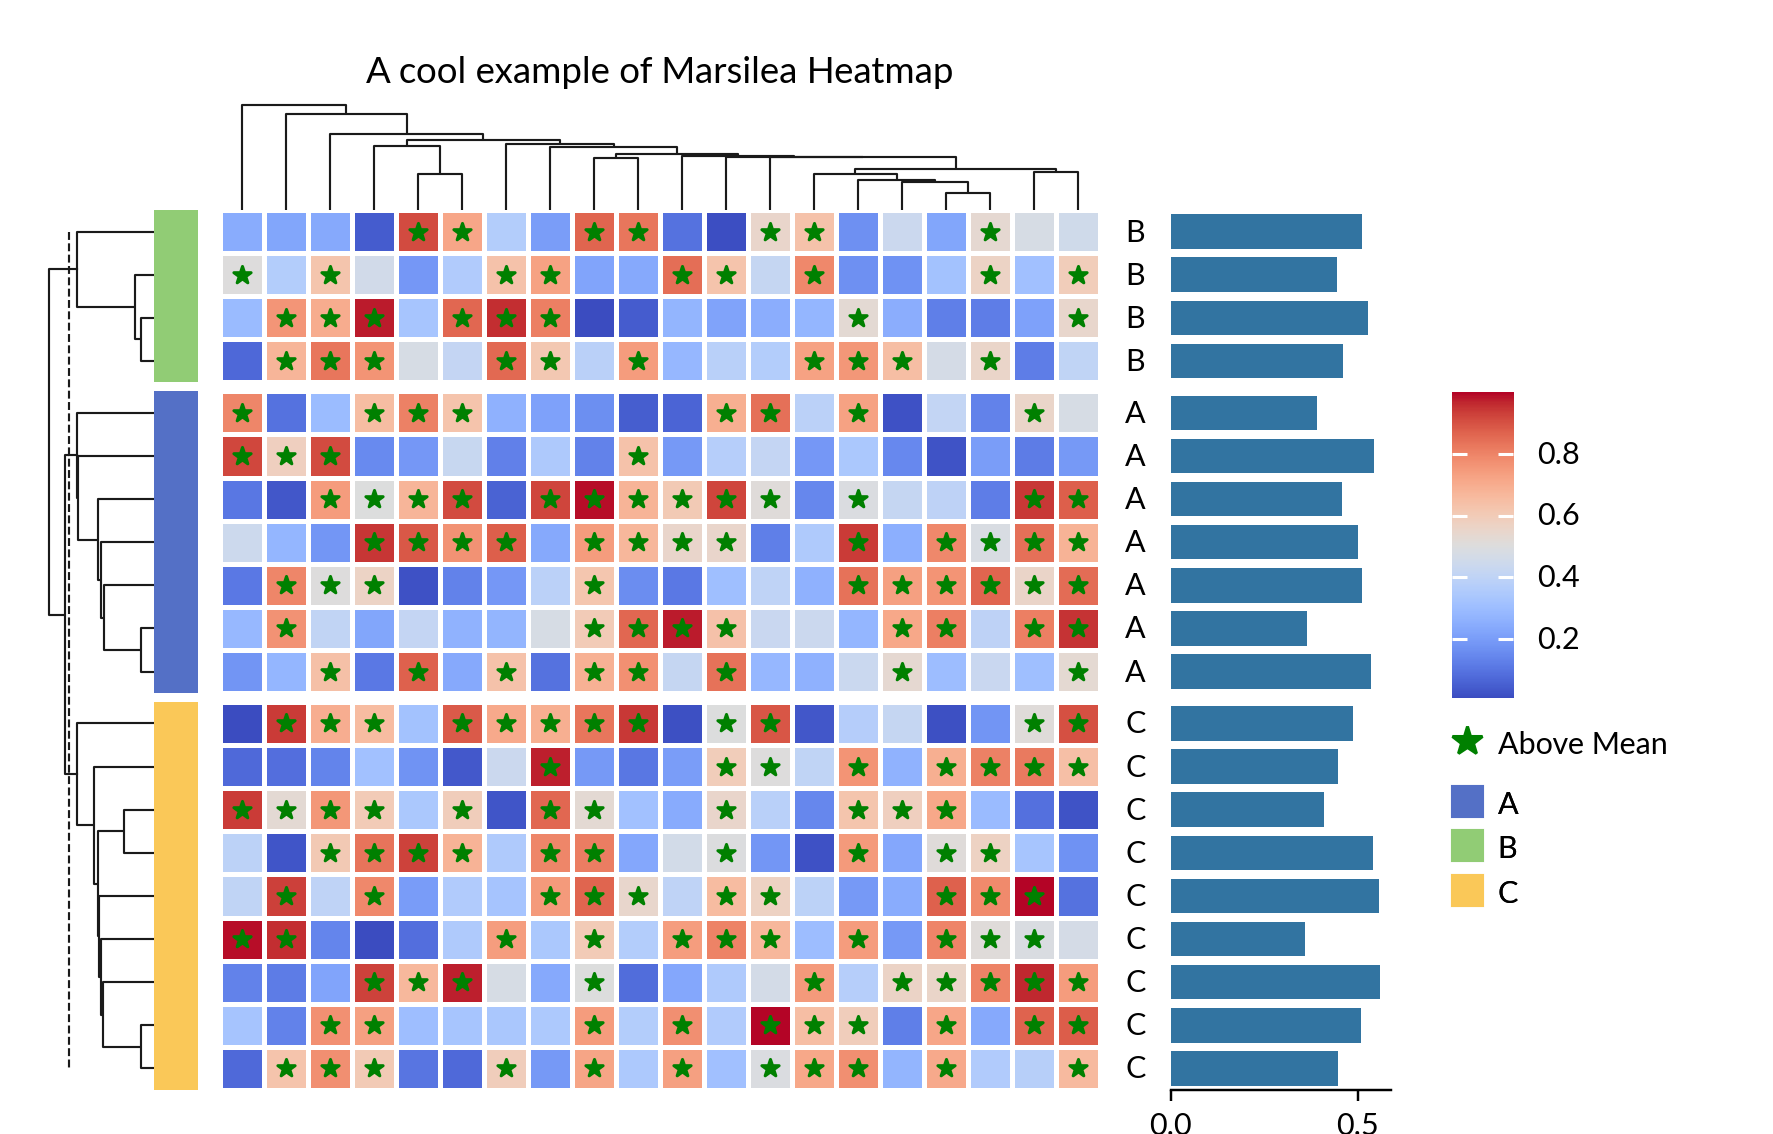
Adding title and legends#
Finally, let’s finish our heatmap by adding a title and legends to it.
>>> h.add_title(top="A cool example of Marsilea Heatmap")
>>> h.add_legends()
>>> h.render()