marsilea.base.WhiteBoard#
- class WhiteBoard(width=None, height=None, name=None, margin=0.2, init_main=True)#
Bases:
LegendMakerThe base class that handle all rendering process
- Parameters:
- widthint, optional
The width of the main canvas in inches
- heightint, optional
The height of the main canvas in inches
- namestr, optional
The name of the main canvas
- marginfloat, 4-tuple, optional
The margin of the main canvas in inches
- init_mainbool, optional
If True, the main canvas will be initialized
See also
Examples
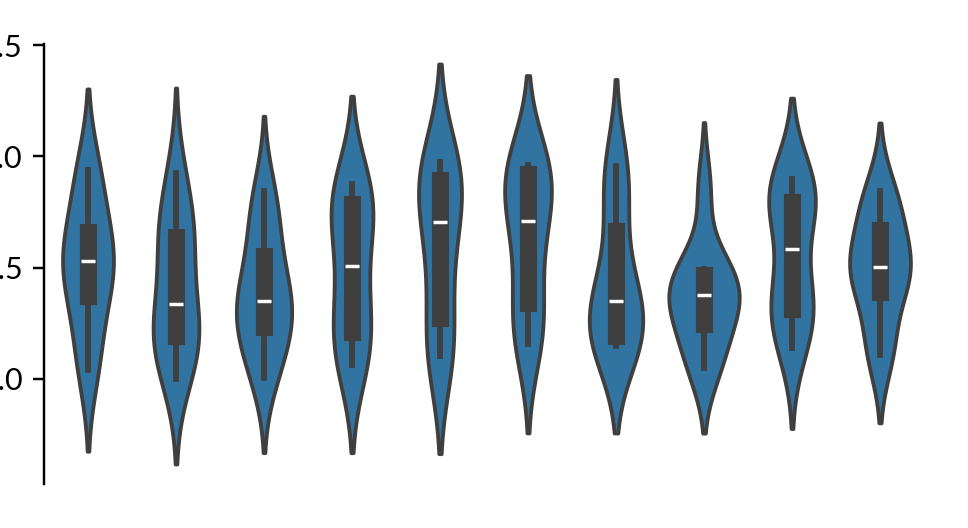
Create a violin plot in white board
>>> import numpy as np
>>> import marsilea as ma
>>> data = np.random.rand(10, 10)
>>> h = ma.WhiteBoard(height=2)
>>> h.add_layer(ma.plotter.Violin(data))
>>> h.render()
- Attributes:
- layoutCrossLayout
The layout manager
- figureFigure
The matplotlib figure object
- add_bottom(plot, name=None, size=None, pad=0.0, legend=True)#
Add a plotter to the bottom-side of main canvas
- Parameters:
- plotRenderPlan
The plotter to add
- namestr, optional
The name of the plot
- sizefloat, optional
The size of the plot in inches
- padfloat, optional
The padding of the plot in inches
- legendbool, optional
If True, the legend will be included when calling
add_legends()
- add_canvas(side, name, size, pad=0.0)#
Add an axes to the main canvas
- Parameters:
- side{“left”, “right”, “top”, “bottom”}
Which side to add the axes
- namestr
The name of the axes
- sizefloat
The size of the axes in inches
- padfloat, optional
The padding of the axes in inches
- add_layer(plot, zorder=None, name=None, legend=True)#
Add a plotter to the main canvas
Note
Not every plotter can be added as a layer.
- Parameters:
- plotRenderPlan
The plotter to add
- zorderint, optional
The zorder of the plot
- namestr, optional
The name of the plot
- legendbool, optional
If True, the legend will be included when calling
add_legends()
- add_left(plot, name=None, size=None, pad=0.0, legend=True)#
Add a plotter to the left-side of main canvas
- Parameters:
- plotRenderPlan
The plotter to add
- namestr, optional
The name of the plot
- sizefloat, optional
The size of the plot in inches
- padfloat, optional
The padding of the plot in inches
- legendbool, optional
If True, the legend will be included when calling
add_legends()
- add_pad(side, size)#
Add padding to the main canvas
- Parameters:
- side{“left”, “right”, “top”, “bottom”}
Which side to add padding
- sizefloat
The size of padding in inches
- add_plot(side, plot, name=None, size=None, pad=0.0, legend=True)#
Add a plotter to the board
- Parameters:
- side{“left”, “right”, “top”, “bottom”}
Which side to add the plotter
- plotRenderPlan
The plotter to add
- namestr, optional
The name of the plot
- sizefloat, optional
The size of the plot in inches
- padfloat, optional
The padding of the plot in inches
- legendbool, optional
If True, the legend will be included when calling
add_legends()
- add_right(plot, name=None, size=None, pad=0.0, legend=True)#
Add a plotter to the right-side of main canvas
- Parameters:
- plotRenderPlan
The plotter to add
- namestr, optional
The name of the plot
- sizefloat, optional
The size of the plot in inches
- padfloat, optional
The padding of the plot in inches
- legendbool, optional
If True, the legend will be included when calling
add_legends()
- add_title(top=None, bottom=None, left=None, right=None, pad=0, **props)#
A shortcut to add title to the main canvas
- Parameters:
- topstr, optional
The title of the top side
- bottomstr, optional
The title of the bottom side
- leftstr, optional
The title of the left side
- rightstr, optional
The title of the right side
- padfloat, optional
The padding of the title in inches
- propsdict
The properties of the title
- Returns:
- add_top(plot, name=None, size=None, pad=0.0, legend=True)#
Add a plotter to the top-side of main canvas
- Parameters:
- plotRenderPlan
The plotter to add
- namestr, optional
The name of the plot
- sizefloat, optional
The size of the plot in inches
- padfloat, optional
The padding of the plot in inches
- legendbool, optional
If True, the legend will be included when calling
add_legends()
- append(side, other)#
Append two
CrossLayouttogether
- figure = None#
- get_ax(name)#
Get a specific axes by name when available
If the axes is split, multiple axes will be returned
Note
This will not work before render is called
- get_main_ax()#
Return the main axes
- layout#
- render(figure=None, scale=1)#
Finalize the layout and render all plots
- Parameters:
- figure
FigureBase, optional The matplotlib figure object
- scalefloat, optional
The scale value of the figure size. You can use this to adjust the overall size of the figure
- figure
- Returns:
- save(fname, **kwargs)#
Save the figure to a file
This will force a re-render of the figure
- Parameters:
- fnamestr, path-like
The file name to save
- kwargsdict
Additional options for saving the figure, will be passed to
savefig()
- set_margin(margin)#
Set margin of the main canvas
- Parameters:
- marginfloat, 4-tuple
The margin of the main canvas in inches