Axes-level customization#
You may find the default style in Marsilea does not fit your taste. You can customize the plot by accessing the axes directly.
Retrieve main axes#
No axes or figure is created or render until you
call the render() method.
After you render the visualization, you can access the main axes by
get_main_ax().
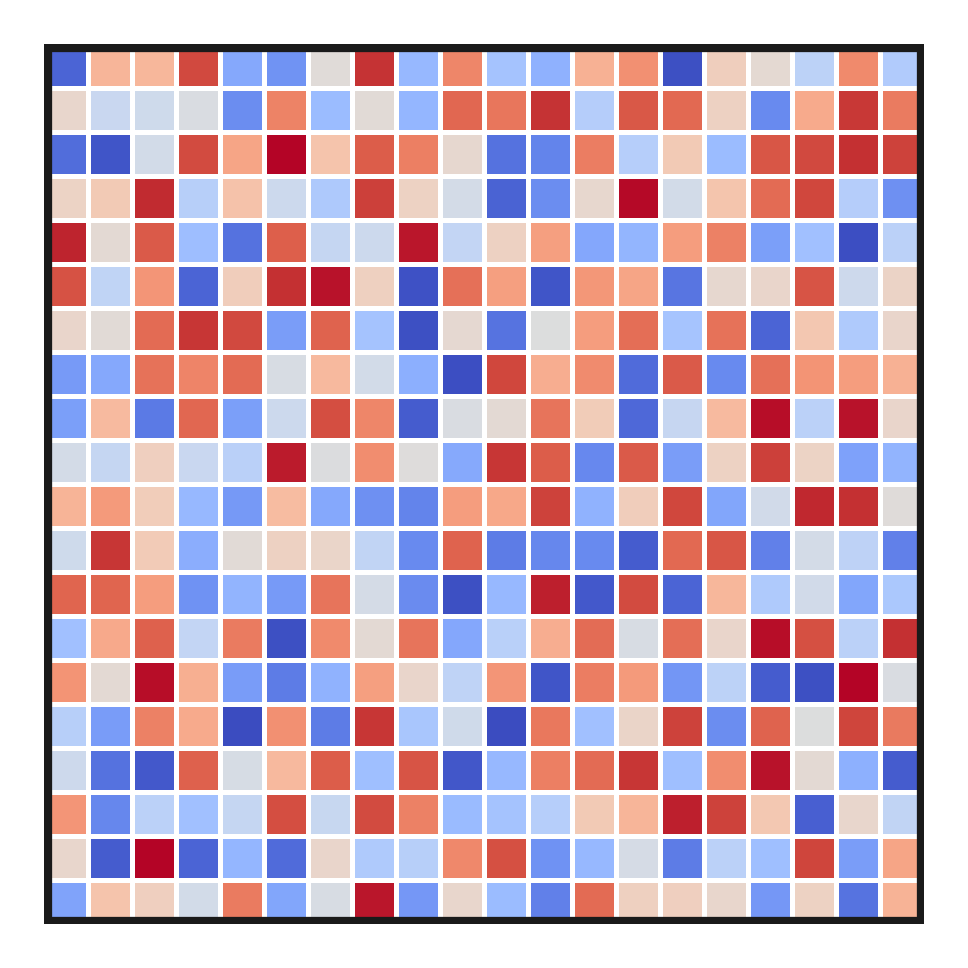
The example below shows how to add a border to your heatmap:
>>> import marsilea as ma
>>> from matplotlib.patches import Rectangle
>>> data = np.random.rand(20, 20)
>>> h = ma.Heatmap(data, linewidth=1)
>>> h.render()
>>> hax = h.get_main_ax()
>>> border = Rectangle((0, 0), 1, 1, fill=False, ec=".1", lw=5, transform=hax.transAxes)
>>> hax.add_artist(border)
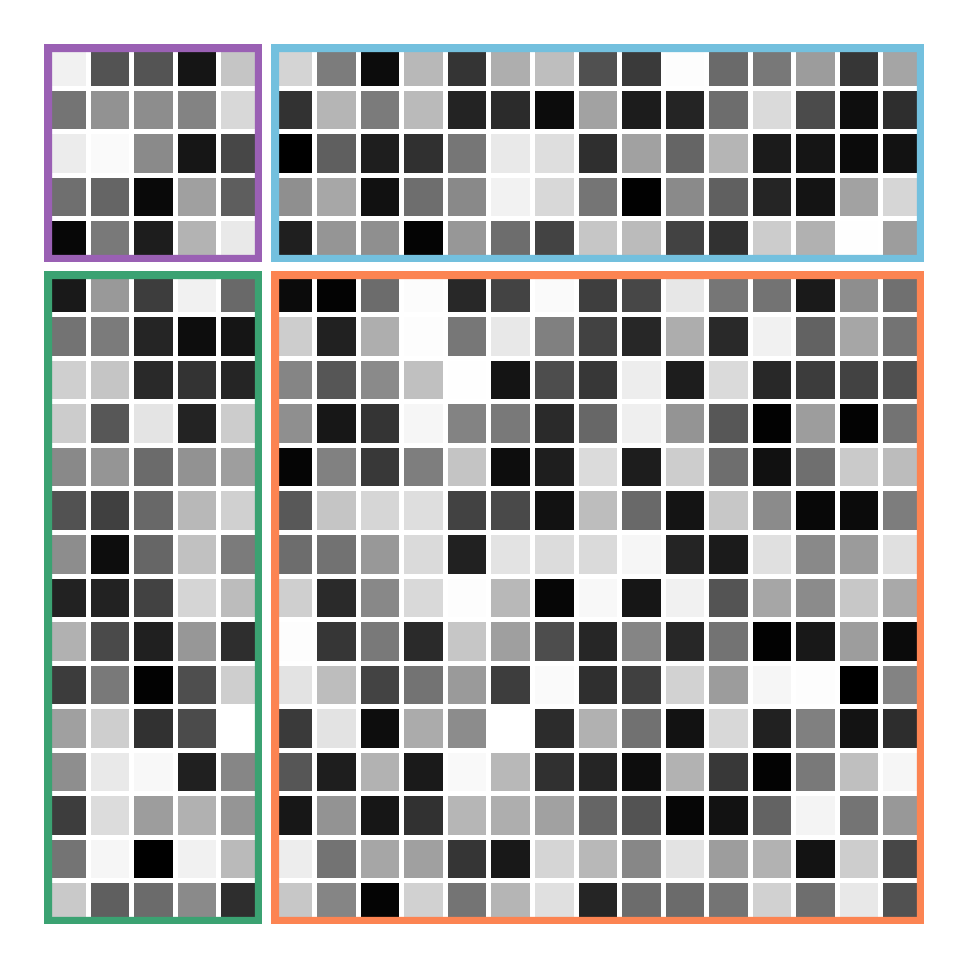
When working with split heatmaps, you’ll receive multiple axes in return, ordered from the upper left to the lower right.
>>> h = ma.Heatmap(data, cmap="binary", linewidth=1)
>>> h.hsplit(cut=[5])
>>> h.vsplit(cut=[5])
>>> h.render()
>>> # Get the ax after render()
>>> hax = h.get_main_ax()
>>> print(hax)
    [<AxesSubplot: > <AxesSubplot: > <AxesSubplot: > <AxesSubplot: >]
>>> colors = ["#9a60b4", "#73c0de", "#3ba272", "#fc8452"]
>>> # purple, blue, green, orange
>>> for ax, c in zip(hax, colors):
...     border = Rectangle((0, 0), 1, 1, fill=False, ec=c, lw=5, transform=ax.transAxes)
...     ax.add_artist(border)
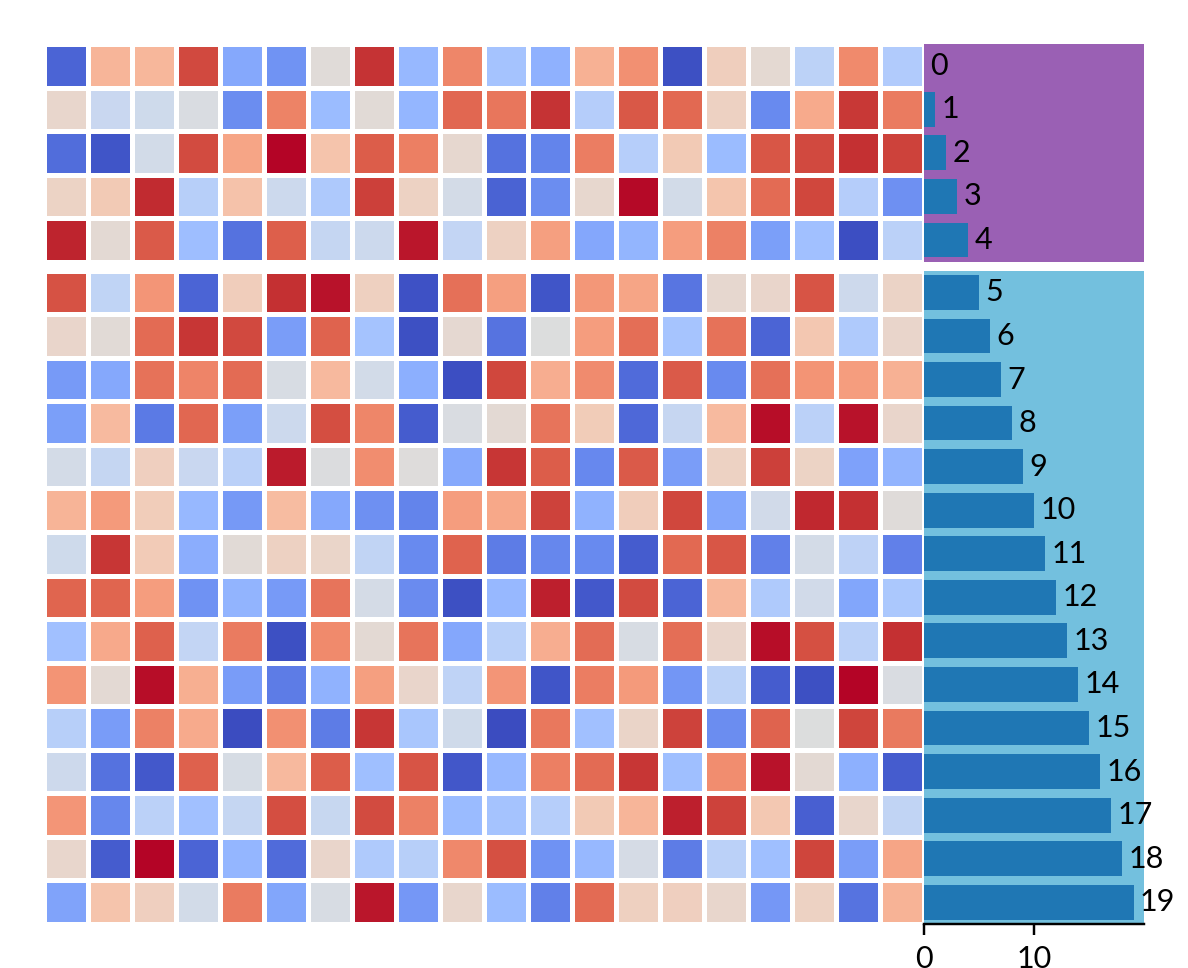
Retrieve side axes#
To retrieve side axes, you must name the plot that you wish to customize first.
Once you assign the name, you can use get_ax()
to retrieve the named axes.
>>> h = ma.Heatmap(data, linewidth=1)
>>> h.hsplit(cut=[5])
>>> bar = ma.plotter.Numbers(np.arange(20))
>>> h.add_right(bar, name="My Bar")
>>> h.render()
>>> # Get the ax after render()
>>> bar_axes = h.get_ax("My Bar")
>>> colors = ["#9a60b4", "#73c0de"]
>>> # purple, blue
>>> for ax, c in zip(bar_axes, colors):
...     bg = Rectangle((0, 0), 1, 1, fc=c, zorder=-1, transform=ax.transAxes)
...     ax.add_artist(bg)